Northwest Indiana Real Estate Market Update: February 2026 vs February 2025
Northwest Indiana Real Estate Market Update
February 2026 vs February 2025
As we move into the spring market, many buyers and sellers are asking the same question: How is the Northwest Indiana housing market performing compared to last year?
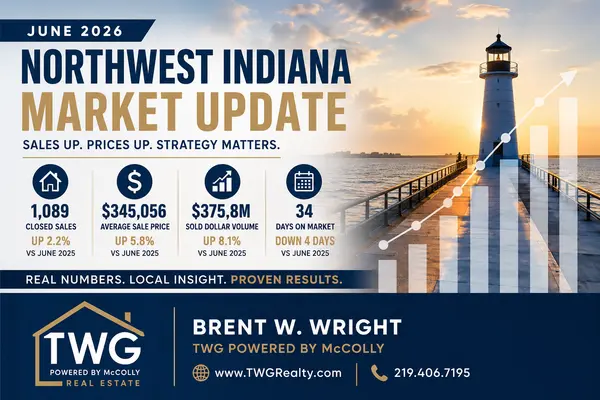
Looking at the Northwest Indiana MLS data, February 2026 showed continued growth in both home prices and sales activity compared to February 2025. Despite higher interest rates than a few years ago, demand for homes across Northwest Indiana remains strong.
YOY
Let’s break down the numbers.
Closed Home Sales
In February 2026, there were:
-
639 homes sold in Northwest Indiana
Feb 2026 Residential
In February 2025, there were:
-
640 homes sold
Feb 2025 Residential
While the number of homes sold was very similar year-over-year, the overall value of those homes increased significantly thanks to rising home prices.
Average Home Price
February 2026
-
Average Sold Price: $301,310
Feb 2026 Residential
February 2025
-
Average Sold Price: $287,800
Feb 2025 Residential
Year-Over-Year Change
Average home prices increased roughly $13,500, or about 4.7% year over year.
This continues the steady appreciation trend we have been seeing throughout Northwest Indiana.
Price Per Square Foot
February 2026
-
$156 per square foot
Feb 2026 Residential
February 2025
-
$150 per square foot
Feb 2025 Residential
That is about a 4% increase in value per square foot, showing that home values continue to rise even when the number of sales remains steady.
Days on Market
February 2026
-
55 average days on market
Feb 2026 Residential
February 2025
-
60 average days on market
Feb 2025 Residential
Homes are selling about 5 days faster than they were last year.
Nearly 45% of homes sold in 30 days or less, showing strong buyer demand across the region.
Feb 2026 Residential
Sale Price vs List Price
February 2026
-
Homes sold for 97.01% of list price on average
Feb 2026 Residential
February 2025
-
Homes sold for 97.21% of list price
Feb 2025 Residential
This shows that while buyers are still negotiating slightly, sellers are still receiving very close to asking price.
Overall Market Activity
Looking at the broader MLS activity across property types:
-
Total homes sold increased 11% year over year
-
Total sold volume increased 15%
-
Average sale price increased about 4%
YOY
These numbers indicate that demand remains strong and home values continue to trend upward across Northwest Indiana.
What This Means for Buyers
Buyers should be aware that:
-
Home prices are still rising
-
Well-priced homes continue to sell quickly
-
Competition can still occur, especially for move-in ready homes
Working with an experienced local Realtor can help you move quickly when the right home hits the market.
What This Means for Sellers
For sellers, this data shows that:
-
Home values are higher than last year
-
Homes are selling faster
-
Buyers are still active despite interest rates
If you are considering selling in 2026, this could still be a strong time to list your home.
Thinking About Buying or Selling?
If you would like a free home value analysis or want to discuss buying a home in Northwest Indiana, feel free to reach out anytime.
Brent W. Wright
Realtor | TWG – The Wright Group
Powered by McColly Real Estate
📧 BrentWrightHomes@gmail.com
📱 219-406-7195
🌐 www.TWGRealty.com
Categories
- All Blogs (80)
- Brent's Market Minute (5)
- Build Your Dream Home (1)
- Buyers (1)
- Buying & Selling Homes (11)
- buying a home (4)
- Cedar Lake IN (1)
- Cedar Lake Indiana Real Estate (1)
- Chesterton IN Real Estate (2)
- Crown Point IN (4)
- Crown Point Indiana Real Estate (1)
- First-Time Homebuyers (6)
- Golf Course Communities (1)
- Griffith Indiana Real Estate (1)
- Home Buying Tips (9)
- Home for sale (22)
- Homes for Sale (4)
- Houses for sale (3)
- Housing Market Trends (4)
- Just Listed (1)
- Lake County Indiana Real Estate (2)
- Land & Acreage (1)
- LaPorte County Indiana Real Estate (2)
- Local Market Insighs (1)
- Lots & Land (1)
- Luxury Homes (1)
- Market Update (2)
- Mortgage & Interest Rate Insights (1)
- Munster Indiana (1)
- New Construction (4)
- Northwest Indiana Real Estate (27)
- Northwest Indiana Real Estate Market Updates (8)
- Portage IN (11)
- Portage IN Homes for Sale (6)
- Portage IN Real Estate (8)
- Portage Indiana Homes for Sale (5)
- Portage Indiana Real Estate (1)
- Porter County Indiana Real Estate (2)
- Porter County Real Estate (2)
- Real Estate (40)
- Real Estate Guides (9)
- Real Estate Listings (3)
- Relocation (1)
- RiverTrace Subdivision (3)
- Sellers (1)
- selling a home (3)
- St. John Indiana Real Estate (1)
- Townhomes (1)
- Valparaiso Homes for Sale (2)
- Valparaiso IN (5)
- Westville IN (1)
Recent Posts