The 2026 U.S. Real Estate Market: A Deep Dive Into America's Hot, Warm, Cool & Cold Housing Markets

The U.S. Housing Market Is Not One Market: A 2026 Deep Dive Into America’s Hot, Warm, Cool and Cold Real Estate Markets
The American housing market is no longer moving as one giant machine. It is behaving more like a weather map.
In one part of the country, buyers are competing for a small number of homes, properties are moving quickly, and prices continue to climb. In another, inventory has returned to pre-pandemic levels, sellers are cutting prices, builders are offering incentives, and buyers finally have room to negotiate.
That is why describing the current real estate market as simply “good,” “bad,” a “buyer’s market,” or a “seller’s market” misses the larger story.
The United States currently has several housing markets operating at the same time:
-
Hot markets where limited inventory is still creating intense competition.
-
Warm markets where demand remains healthy but buyers are becoming more selective.
-
Cool markets where inventory is rising and sellers are losing some pricing power.
-
Cold markets where prices, contracts, or buyer activity are weakening across several measurements.
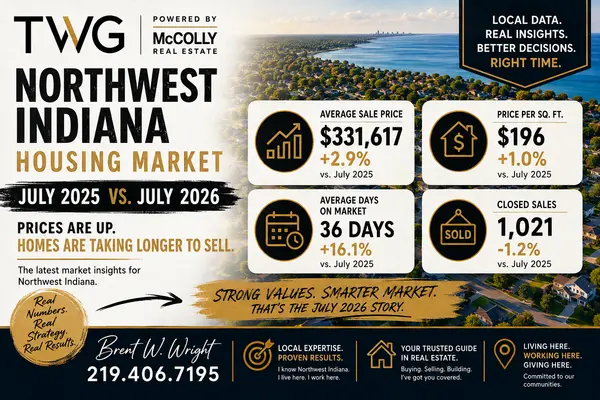
Northwest Indiana occupies an especially interesting position. It remains substantially more affordable than the national market and the Chicago metropolitan area, while inventory is still limited enough to support prices. It is not experiencing the full bidding-war fever found in the hottest Northeastern markets, but it is also far from the soft conditions appearing in parts of the South and West.
The National Housing Market at a Glance
As of June 2026, existing-home sales were running at a seasonally adjusted annual rate of approximately 4.09 million homes. That was 2.4% lower than May but 2.8% higher than one year earlier. The national median existing-home sale price reached $440,600, an increase of 1.8% from June 2025. Inventory totaled approximately 1.56 million homes, representing a 4.6-month supply.
| National housing indicator | June or July 2026 reading |
|---|---|
| Existing-home sales rate | 4.09 million annually |
| Median existing-home sale price | $440,600 |
| Existing-home inventory | 1.56 million homes |
| Months of supply | 4.6 months |
| Median days on market | 28 days |
| First-time buyers | 33% of sales |
| Cash buyers | 25% of sales |
| Investor and second-home purchases | 13% of sales |
| 30-year fixed mortgage rate | 6.58% on July 23 |
Mortgage rates remain the giant boulder sitting in the middle of the housing road. Freddie Mac reported an average 30-year fixed rate of 6.58% on July 23, 2026, up from 5.98% in late February. Although rates have bounced around throughout the year, they have generally remained high enough to constrain affordability, discourage homeowners from giving up older low-rate mortgages, and reduce the buying power of households that depend on financing.
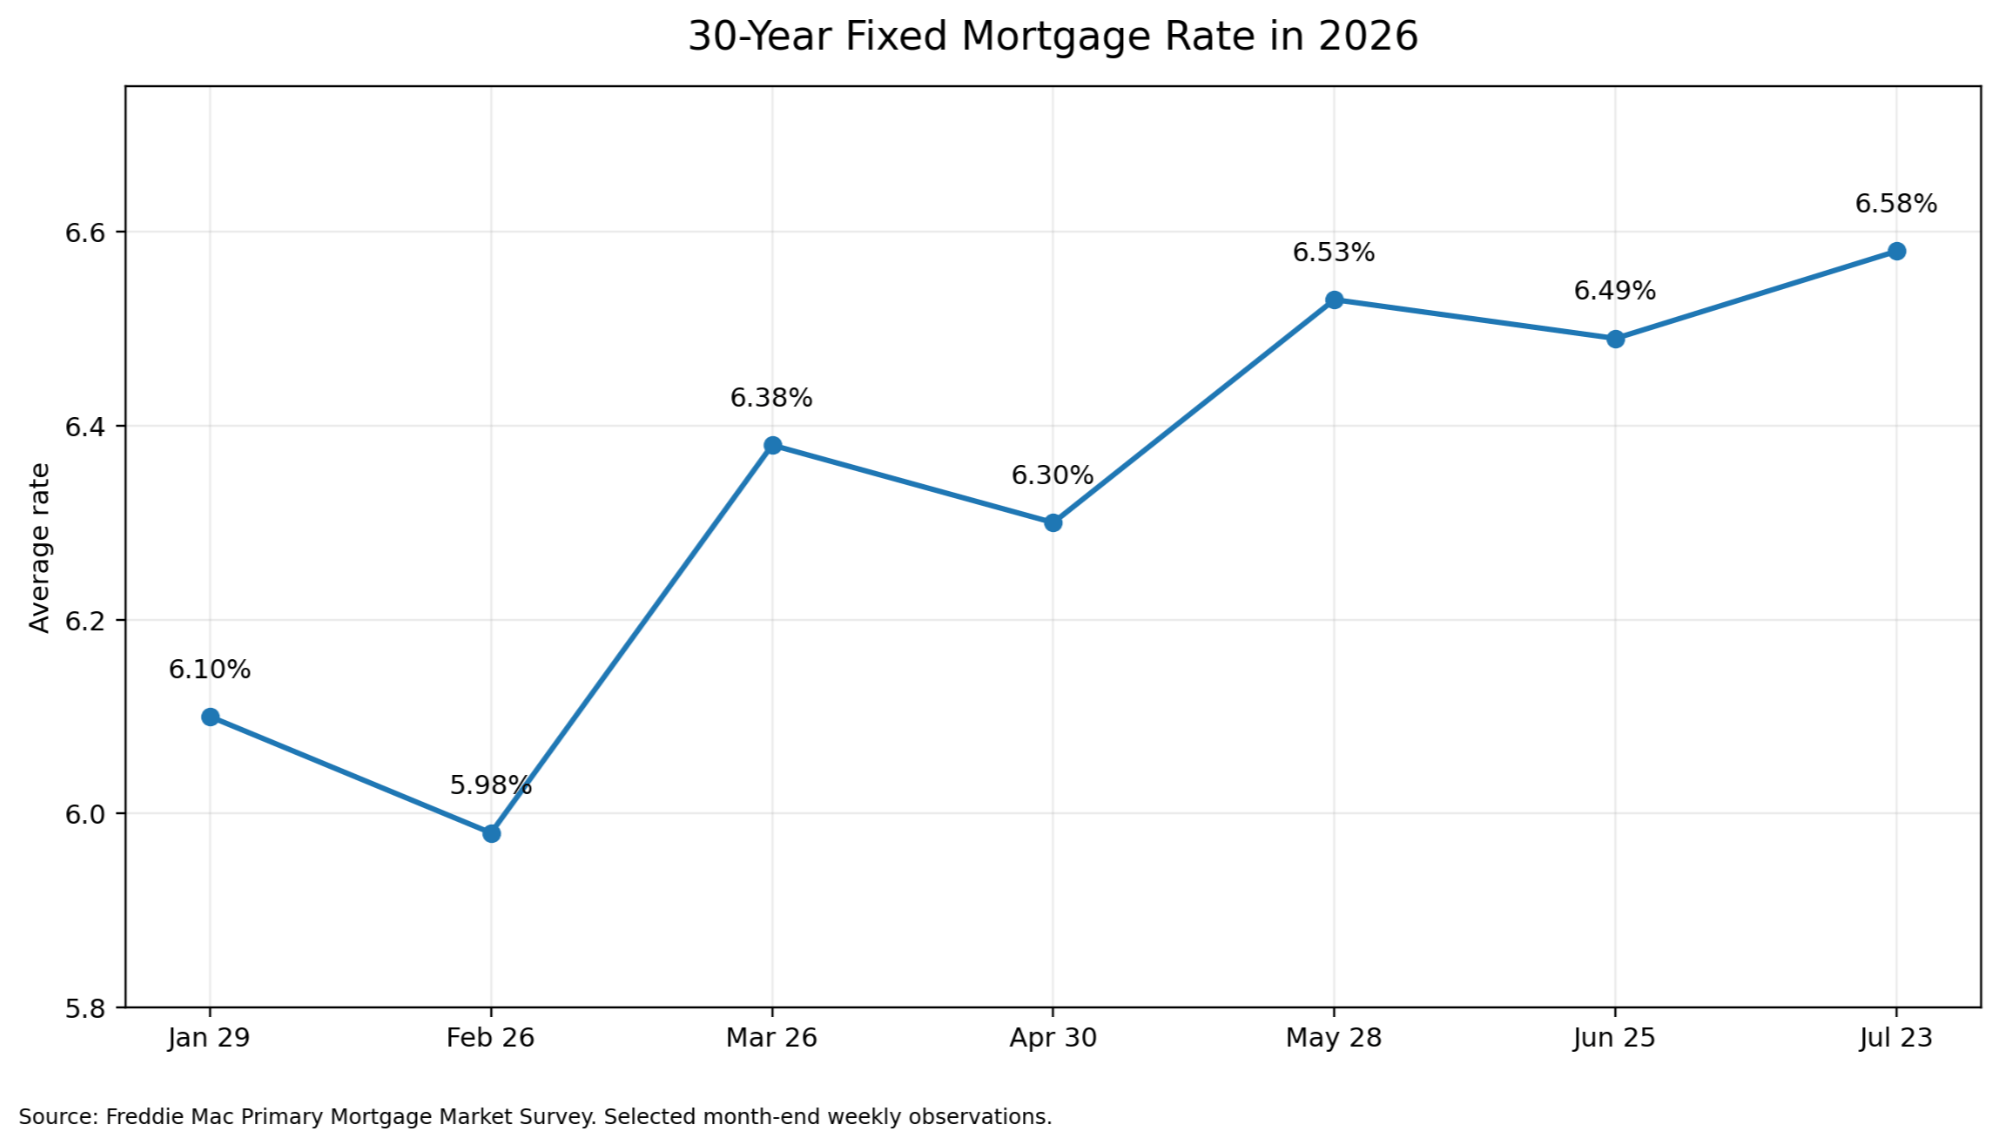
Suggested caption: Average 30-year mortgage rates briefly dipped below 6% in February 2026 before climbing back above 6.5% by late July.
Why Are Sale Prices Rising While Listing Prices Are Falling?
One of the most important contradictions in the current market is that national closed-sale prices are still rising, while asking prices are declining.
Realtor.com reported a national median listing price of approximately $430,000 in June, down 2.5% from the previous year. This was the eighth consecutive annual decline in listing prices and the largest decline in its data series going back to 2017. Price per square foot was also down 2.1%. Meanwhile, the National Association of REALTORS reported that the median price of completed existing-home sales increased 1.8%.
Those numbers are not necessarily contradictory because the measurements capture different parts of the market:
-
Listing data measures what sellers are currently asking.
-
Closed-sale data measures transactions negotiated weeks or months earlier.
-
The mix of homes being sold can move the median even when individual home values are not rising equally.
-
Sellers may begin with lower asking prices to attract buyers, while desirable homes still receive strong offers.
-
Regional strength in expensive markets can lift the national median.
The national market is therefore not experiencing a uniform price collapse. It is experiencing a gradual repricing process. Sellers are becoming more realistic, buyers are more payment-sensitive, and properties with inflated asking prices are increasingly being punished by the market.
The Four Housing-Market Temperatures
For this analysis, a market’s temperature is determined by five measurements:
-
Inventory relative to historical norms
-
Days on market
-
Buyer demand and pending sales
-
Price growth or decline
-
Frequency of seller price reductions
A hot market does not simply mean that prices are high. A very expensive market can be cold if buyers are retreating. Likewise, an affordable market can be hot when homes sell rapidly and inventory remains scarce.
HOT: The Northeast and Great Lakes Secondary Markets
The hottest housing markets in 2026 are concentrated heavily in the Northeast, New England, upstate New York, Pennsylvania, Wisconsin, and northern Illinois.
Realtor.com’s June market-hotness rankings placed Hartford, Connecticut first nationally, followed by Erie, Pennsylvania; Norwich-New London, Connecticut; Kenosha, Wisconsin; and Waterbury-Shelton, Connecticut. Manchester-Nashua, Rochester, Amherst-Northampton, Bridgeport-Stamford and Rockford completed the top ten. Homes in these markets generally attracted between 2.4 and 4.5 times the listing views of the average U.S. property and commonly sold in approximately 27 to 34 days.
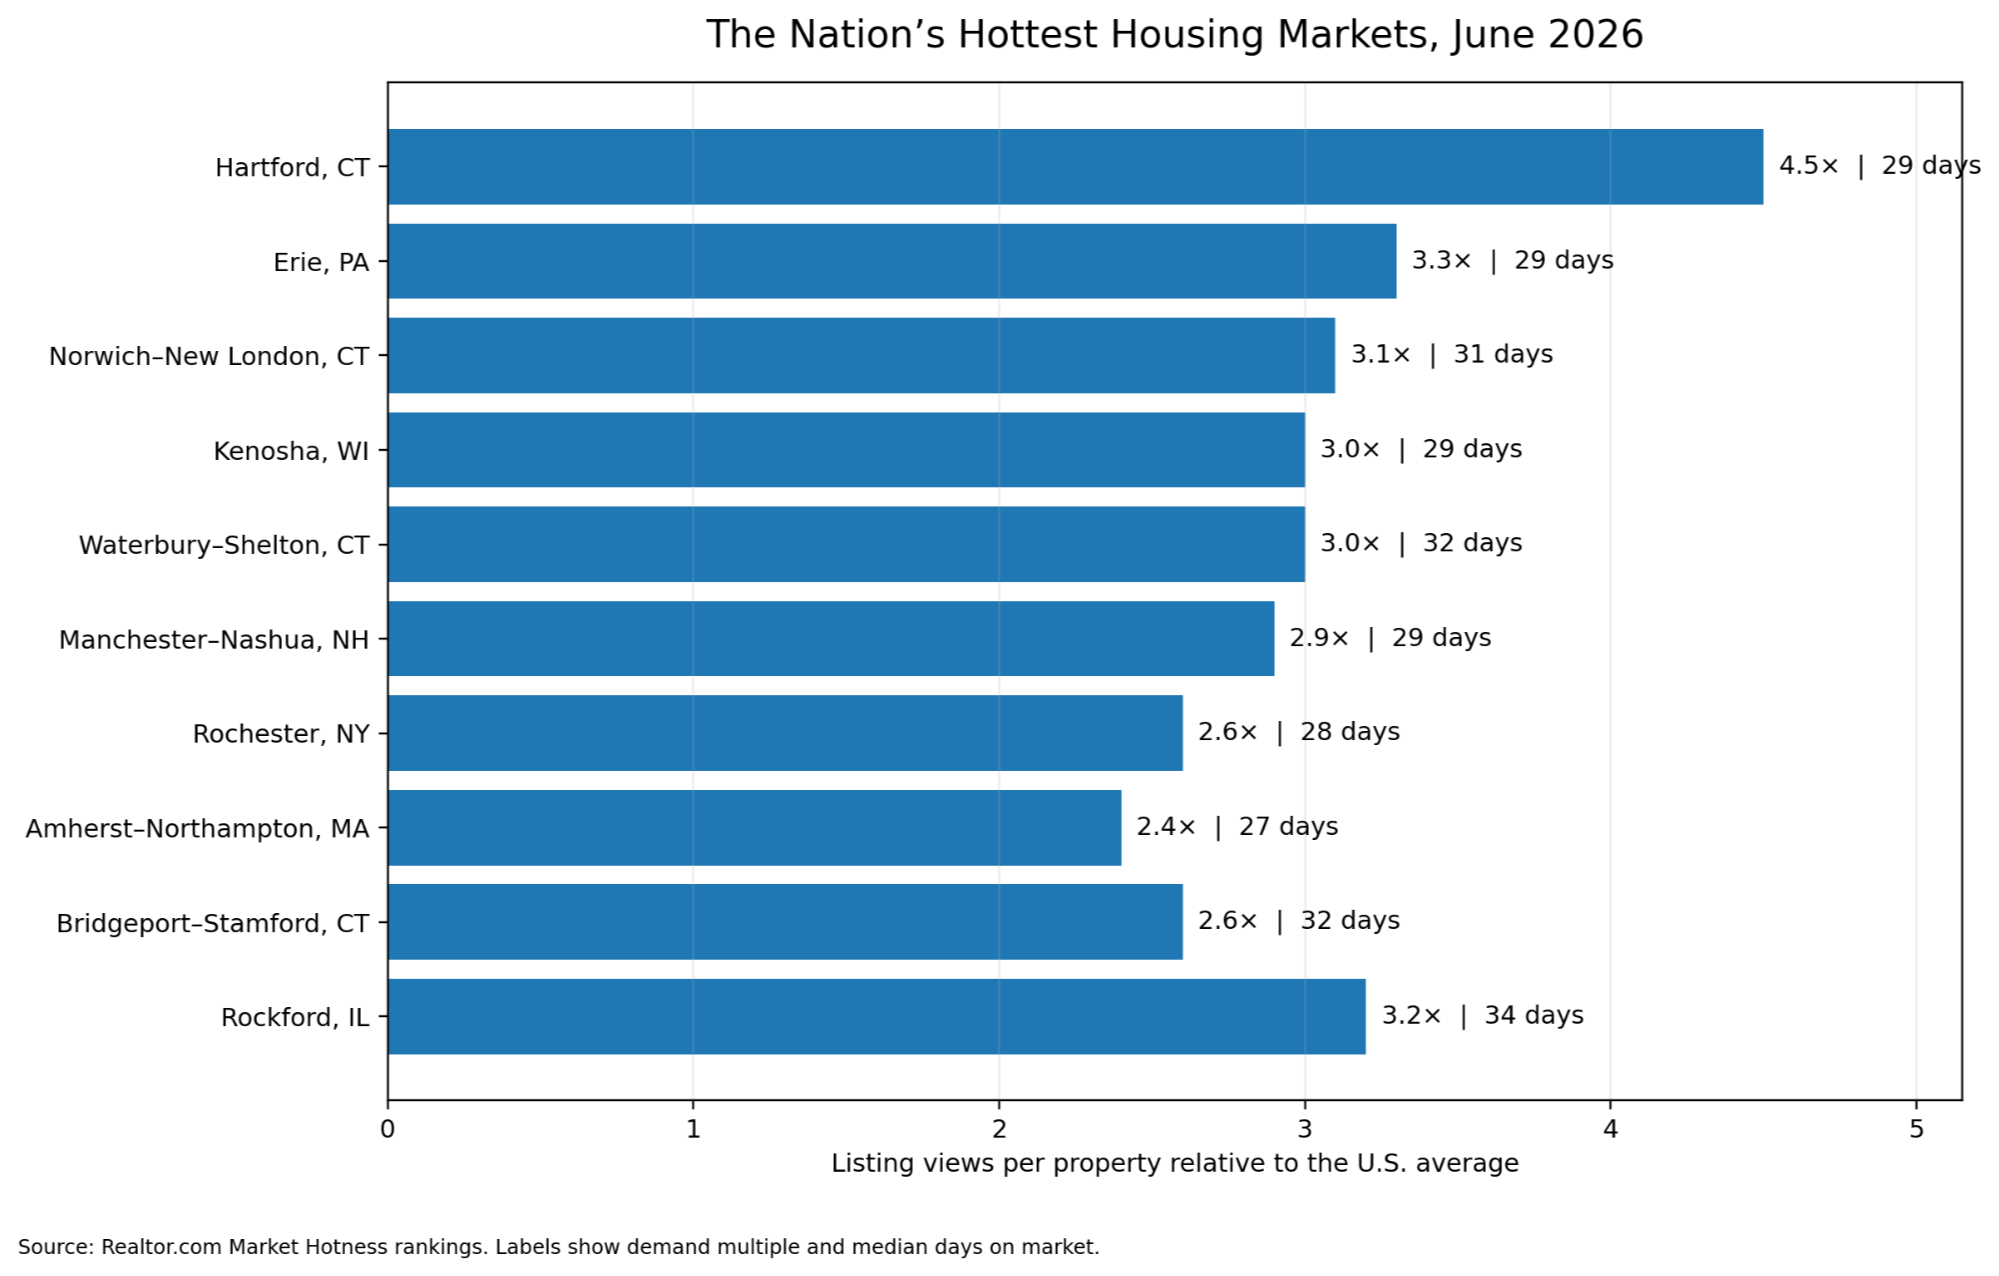
Suggested caption: Hartford led the country in listing demand during June 2026, while affordable Great Lakes markets such as Kenosha and Rockford also ranked among the nation’s hottest.
The Northeast remains hot primarily because it has not rebuilt its housing inventory.
Active listings in the region were still approximately 47.3% below 2017 through 2019 norms in June. Median marketing time was only 42 days, and just 12.5% of listings had received a price reduction. That was the lowest price-cut rate of any region.
Several of these markets have remained hot for years. Since June 2022, listing prices reportedly increased approximately 43% in Rochester, 26% in Hartford, 25% in Manchester-Nashua, 20% in Worcester and 18% in Springfield, Massachusetts. National listing prices declined over that same general period.
This creates an important warning.
A market can remain hot while becoming less affordable. The same limited supply that protects homeowners’ values can eventually exclude first-time buyers. Some of the Northeast’s hottest markets are no longer inexpensive, even when they remain cheaper than nearby Boston or New York City.
The Great Lakes markets tell a slightly different story. Kenosha, Rockford, Racine and Erie combine relative affordability with access to established employment centers. Their heat appears to be driven not only by limited supply but also by buyers seeking alternatives to more expensive nearby metropolitan areas.
WARM: The Midwest, Chicago and Other Supply-Constrained Markets
The broader Midwest is best described as warm, with several hot pockets.
Median listing prices in the Midwest were essentially unchanged from one year earlier in June, while price per square foot increased approximately 1.5%. Active inventory rose 7.3%, but it remained approximately 36% below pre-pandemic levels. Homes spent a median of 43 days on the market, and 16.5% of listings had received price reductions.
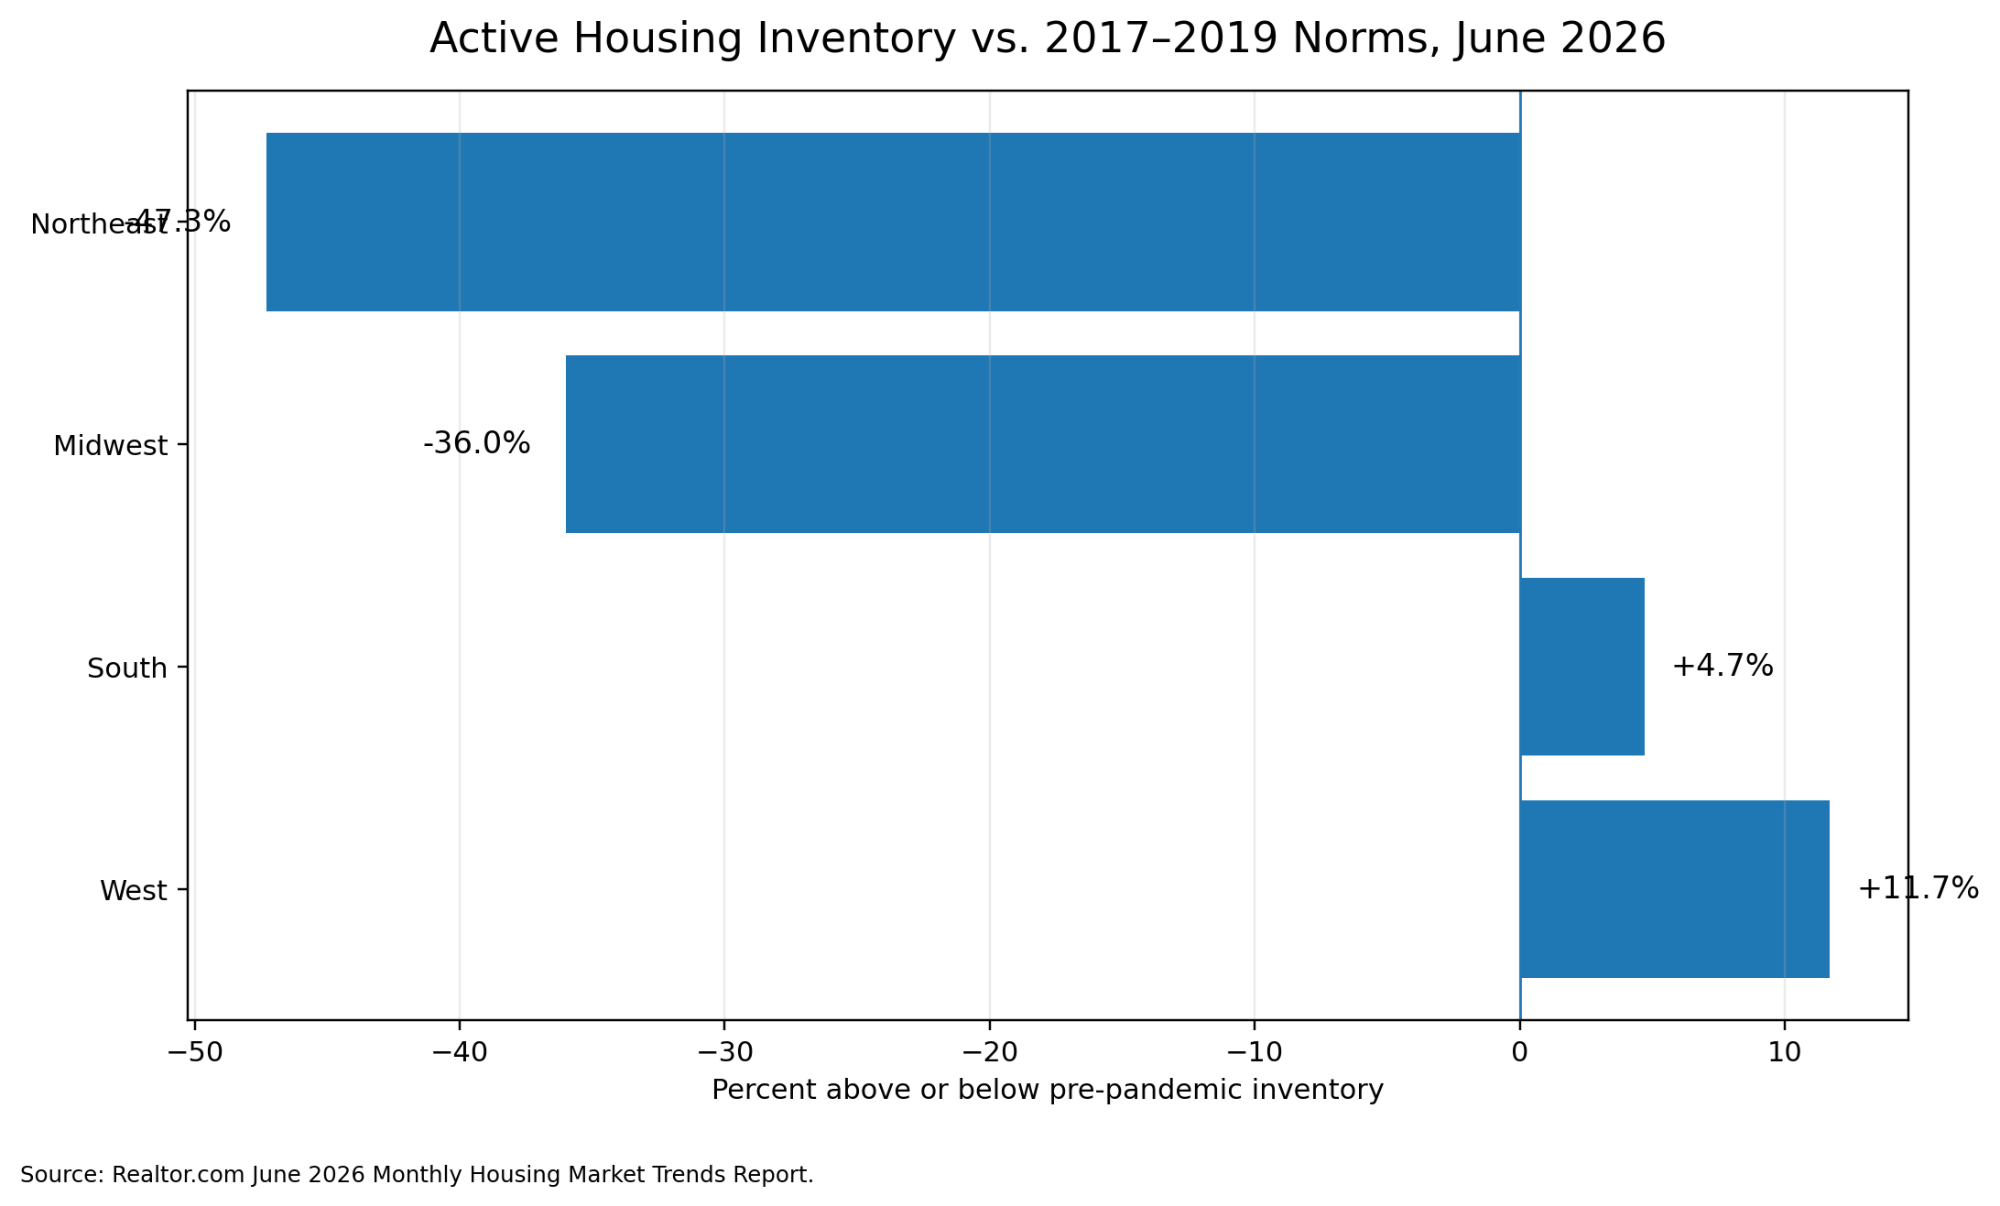
Suggested caption: The Northeast and Midwest remain dramatically undersupplied compared with the years immediately before the pandemic, while the South and West have moved above their former inventory levels.
This is a healthier form of strength than the nearly frozen conditions that defined 2021 and early 2022. Buyers have more choices, but inventory has not increased enough to hand them complete control.
The Chicago metropolitan area illustrates this dynamic.
Approximately 9,927 homes were sold across the Chicago metro during June, an increase of 3.9% from the prior year. The median sale price increased 4.6% to approximately $407,000, while inventory declined 14.4%. Within the City of Chicago, the median price reached approximately $427,500, up 6.9%, as inventory declined nearly 29%.
Indiana also continued to outperform much of the nation. The state recorded approximately 8,563 closed sales in June, an 8% annual increase, while the median sale price increased 5% to approximately $290,000.
These markets are supported by a combination of affordability, limited new supply, comparatively stable employment and households relocating away from more expensive coastal or urban markets.
COOL: Much of the South and West
The South and West have become markedly more buyer-friendly.
Active inventory in June was approximately 4.7% above pre-pandemic levels in the South and 11.7% above pre-pandemic levels in the West. Median listing prices declined 2.5% in the South and 4% in the West. More than 20% of listings in each region had received price reductions.
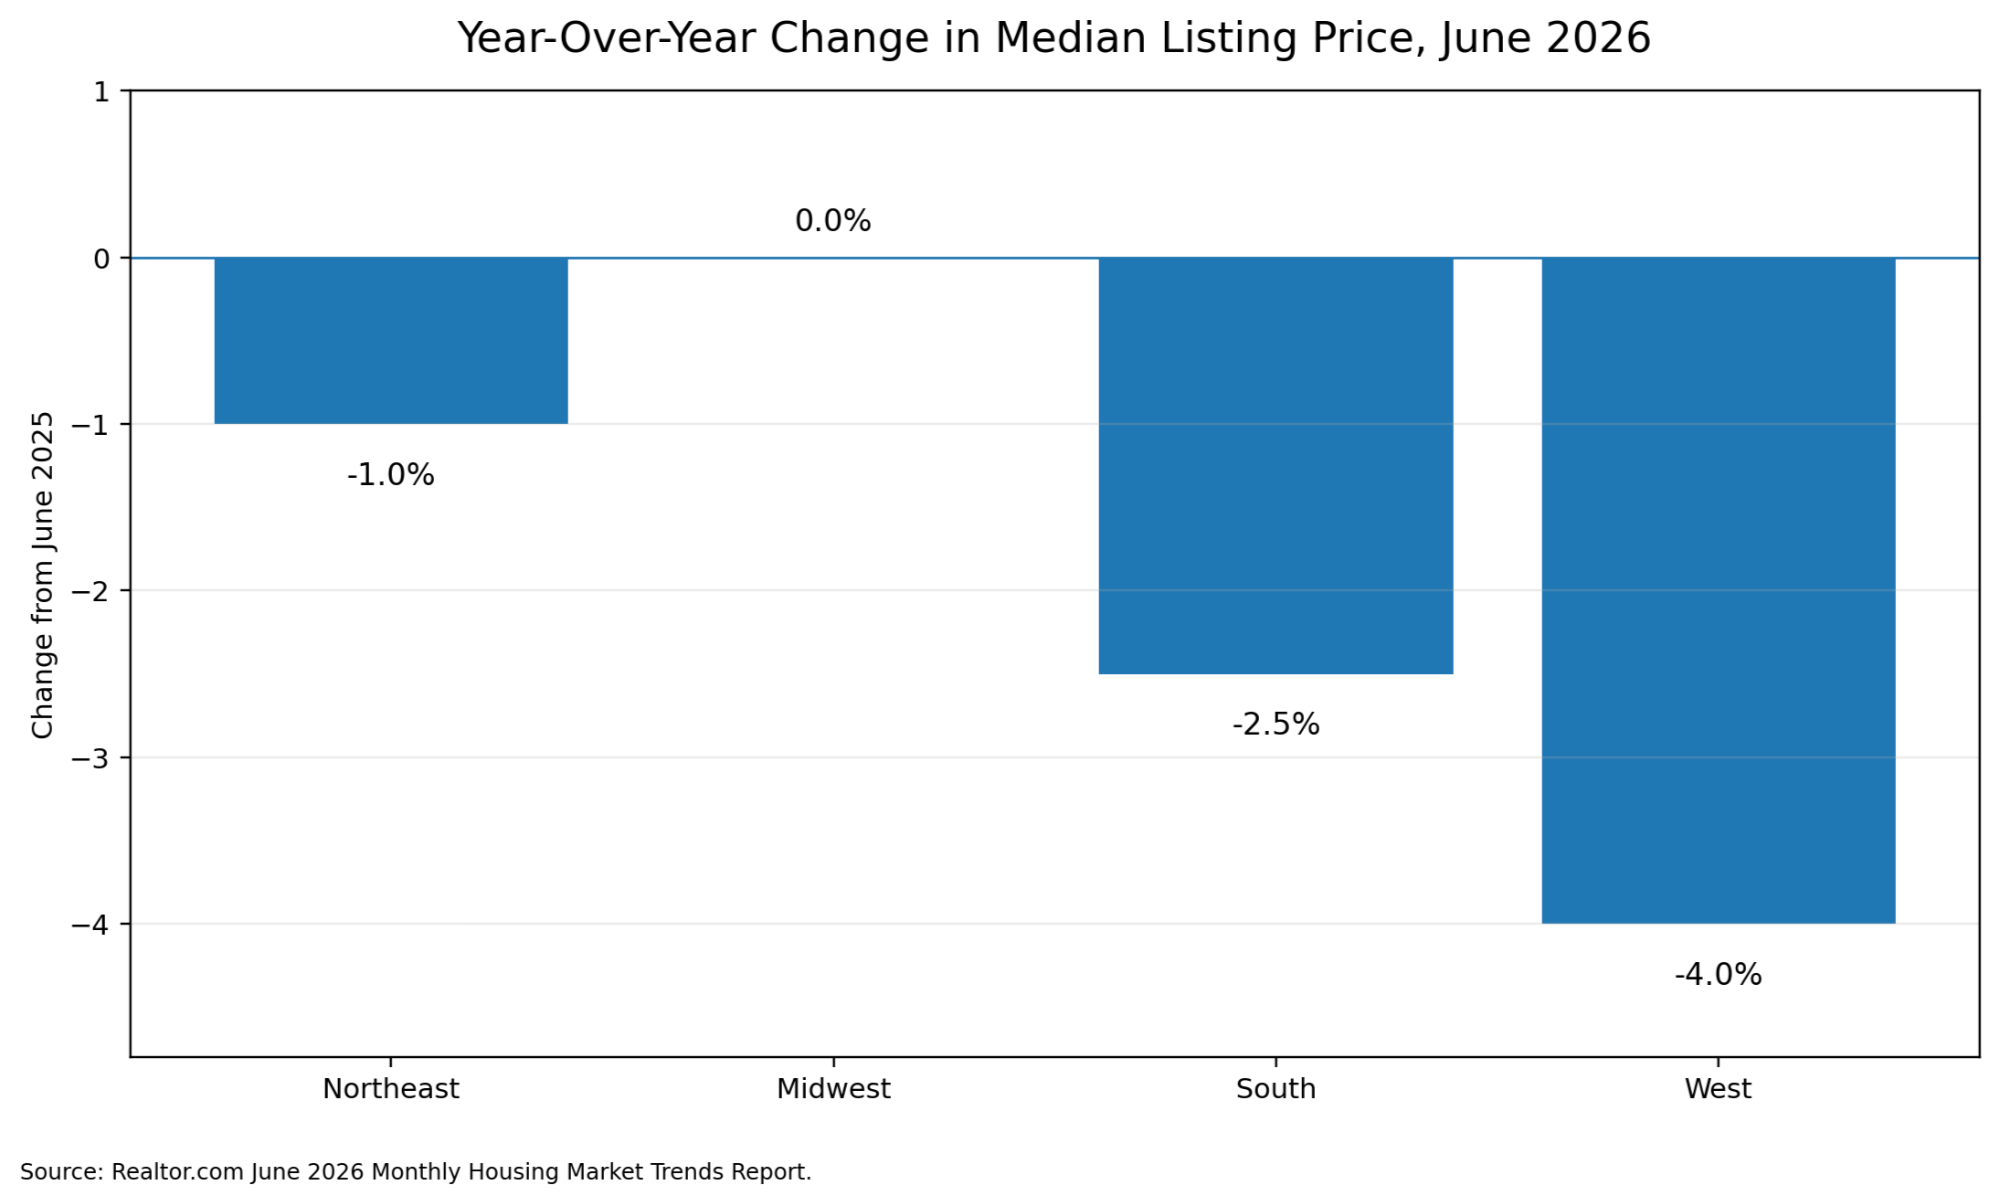
Suggested caption: Listing prices are declining most sharply in the West, while the Midwest has remained comparatively stable.
These markets are not necessarily experiencing widespread distress. In many cases, they are simply unwinding the extreme conditions created by pandemic-era migration, cheap financing, investor demand and rapid construction.
During the pandemic, cities such as Austin, Phoenix, Tampa, Dallas and Denver absorbed enormous demand. Builders responded by producing more homes, while homeowners and investors increasingly listed properties after appreciation slowed. As inventory rose, buyers no longer needed to treat every listing as the final lifeboat leaving the dock.
That shift has created:
-
Longer marketing times
-
More seller concessions
-
Mortgage-rate buydowns
-
Greater competition from new construction
-
More frequent price reductions
-
A larger gap between correctly priced and overly ambitious listings
A cool market can still produce successful sales. It simply requires better pricing, presentation and negotiation.
COLD: Markets With Multiple Weakness Signals
A truly cold market should display weakness in more than one category. Declining prices alone are not sufficient. The colder markets currently combine rising inventory, frequent price cuts, slower pending sales or falling buyer demand.
In June, approximately 29% of listings in Denver had received price reductions, followed by 28.7% in Phoenix and 27.6% in Austin. Austin also experienced an estimated 8.2% annual decline in listing price per square foot, one of the largest drops among major metropolitan areas.
Redfin’s four-week data through July 12 showed pending sales declining approximately 14.4% in Houston, 12.1% in Seattle, 5.2% in Denver and 3.2% in Phoenix. Seattle’s median sale price was also down approximately 4% from the prior year.
Austin is particularly interesting because its data is beginning to split. Its asking-price and price-cut measurements remain weak, but pending sales increased approximately 13.7% in Redfin’s July reporting. That could be an early sign that lower prices and improved negotiating conditions are attracting buyers back into the market.
This demonstrates why labels should not become permanent tattoos. A cold market can begin thawing before prices visibly recover. Pending contracts and buyer traffic frequently improve before closed-sale statistics turn upward.
New Construction Is Quietly Reshaping the Market
The new-home market is one of the strongest sources of negotiating leverage for buyers.
New single-family home sales were running at an annualized rate of approximately 628,000 in June, down 5.6% from the previous year. Approximately 485,000 new homes were available for sale, representing a substantial 9.3-month supply. The median new-home sale price declined 2.7% to approximately $398,300.
That median was lower than the $440,600 median reported for existing homes, although the two figures should not be treated as a direct apples-to-apples comparison. New homes are concentrated in different regions and include a different mixture of sizes, lot types and product categories.
Builders can react more quickly than individual homeowners. They may reduce prices, construct smaller floor plans, offer closing-cost credits or buy down a buyer’s mortgage rate. A homeowner with a low-rate mortgage and a specific net-proceeds requirement does not have the same flexibility.
Construction data also remains mixed. Housing starts jumped during June, but single-family starts were nearly flat from May. Building permits declined, suggesting builders are still carefully controlling how much additional supply they bring into the market.
Where Does Northwest Indiana Fit?
Northwest Indiana is best classified as a warm-to-hot housing market, depending on the community and property type.
It is not uniformly hot. Some homes still sit, especially when they are overpriced, dated or located in a weaker micro-market. However, the region continues to benefit from limited inventory, relative affordability, proximity to Chicago, lower Indiana property taxes and steady demand from both local households and Illinois-area buyers.
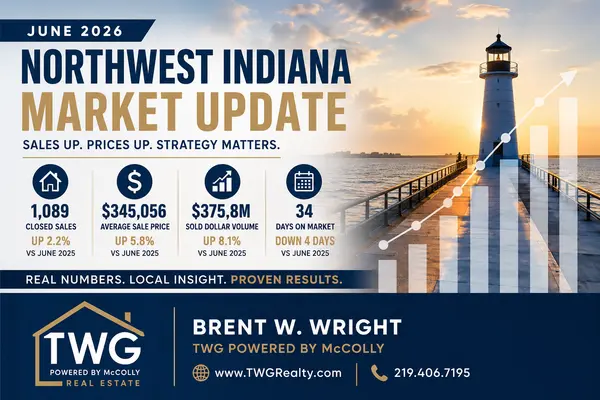
A local compilation of Northwest Indiana REALTORS Association MLS data reported approximately 1,072 total home sales in June, an increase of 5% from the previous year. Existing single-family houses recorded a median sale price of approximately $310,000, up 9%. The average property spent 44 days on the market, but the median home accepted an offer after only 14 days.
The difference between 44 average days and 14 median days tells an important story. Well-positioned properties are still selling rapidly, while a smaller number of stale or overpriced listings pull the average upward.
The same report indicated that buyers averaged approximately 7.3 showings per active existing-home listing, down from 8.0 the previous year. Total inventory increased modestly, while advertised new-construction inventory fell approximately 17%. This points to a market that continues to lean toward sellers but is becoming more selective.
Northwest Indiana’s Affordability Advantage
At approximately $310,000, Northwest Indiana’s median existing-house price was:
-
Roughly 30% below the national existing-home median
-
Approximately 24% below the Chicago metropolitan median
-
Approximately 11% below the broader Midwest median
Those differences are calculated from June 2026 market medians and are one of Northwest Indiana’s most powerful competitive advantages.
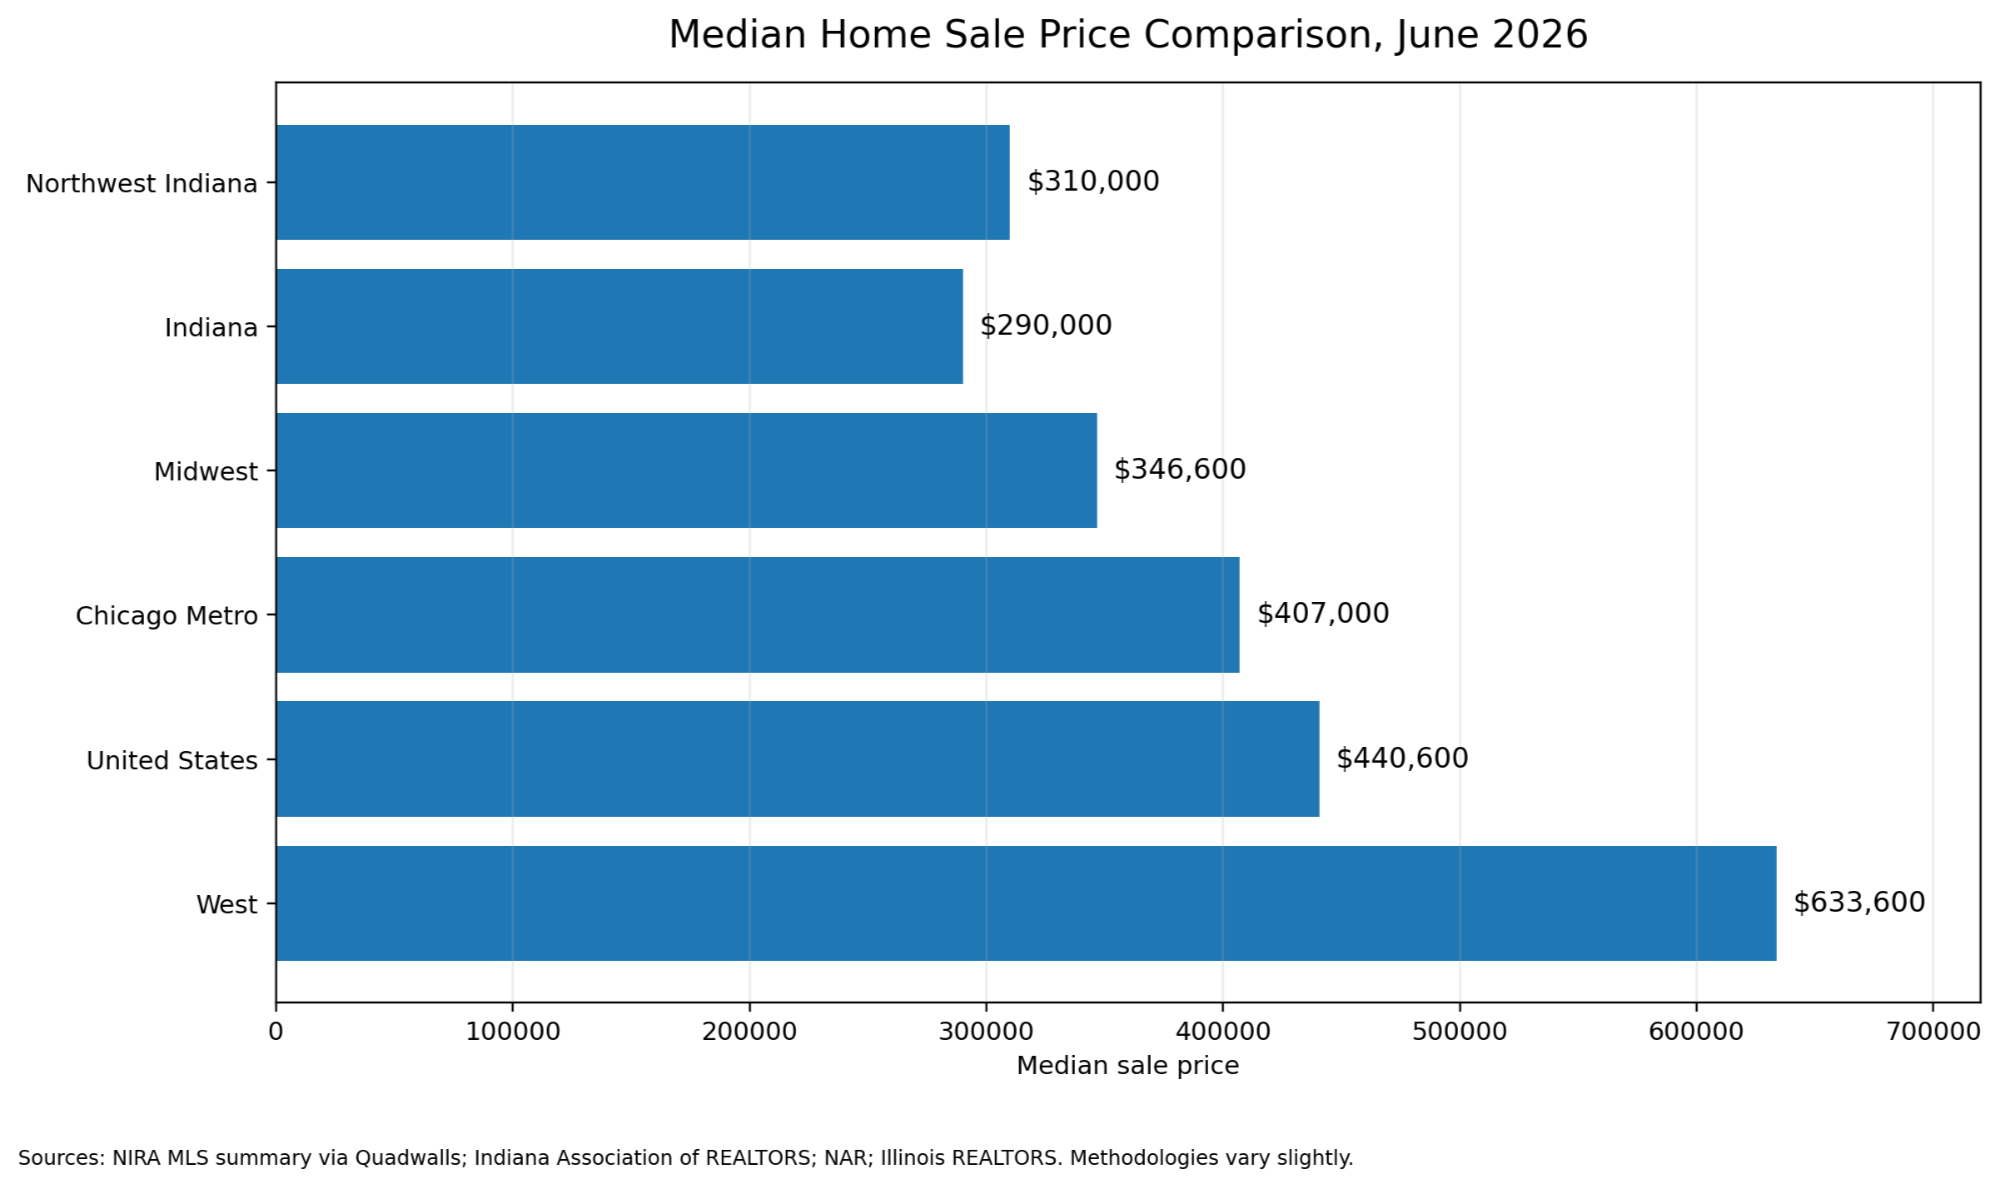
Suggested caption: Northwest Indiana remains considerably more affordable than the Chicago metropolitan area, the broader Midwest and the United States.
A buyer moving from Illinois may be able to purchase more house, more land or a newer property without moving hundreds of miles away from Chicago’s economic orbit. That affordability moat helps support demand even when mortgage rates are elevated.
However, the moat can narrow. If Northwest Indiana prices continue growing materially faster than household income, the region could gradually lose some of the affordability that currently makes it attractive.
Northwest Indiana Is Several Markets, Not One
Just as the United States cannot be reduced to one market, Northwest Indiana cannot be analyzed using one regional number.
Hotter Communities and Submarkets
Crown Point, St. John, Schererville, Hobart and several western or southern Lake County communities continue to demonstrate strong demand.
Redfin’s three-month data through May showed a median price of approximately $329,803 in Crown Point, up 11.2% annually. St. John reached approximately $439,737, up 5.2%, while Schererville increased 4.3% to approximately $349,791. Hobart’s median rose approximately 13.1% to $249,850.
These communities benefit from school demand, access to major highways, newer housing options and proximity to Illinois employment.
Warm and More Balanced Communities
Portage and Valparaiso remain active, but buyers have enough choice to distinguish sharply between strong listings and weaker ones.
Portage’s median sale price was approximately $294,824, up 1.7%, with a median marketing time of 37 days. Valparaiso’s median reached approximately $354,688, up 4.3%, also with a 37-day median.
Porter County’s three-month median declined approximately 2.3%, but sales increased 6.5% and median marketing time improved from 50 days to 29 days. That combination does not necessarily indicate a declining market. It may reflect a change in the mix of homes sold, with a larger share of lower-priced properties closing during the period.
Higher-Growth but More Volatile Markets
Gary and LaPorte County produced some of the region’s largest reported percentage increases.
Gary’s median sale price rose approximately 29.8% to $118,779, while LaPorte County’s median increased 17.4% to approximately $264,208. LaPorte County sales also increased more than 30%.
Those gains deserve attention, but they require careful interpretation. In lower-volume or lower-price markets, a relatively small change in the types of homes sold can produce a dramatic percentage swing. A greater number of renovated homes, investor transactions or higher-quality properties can lift the median without every home appreciating at the same pace.
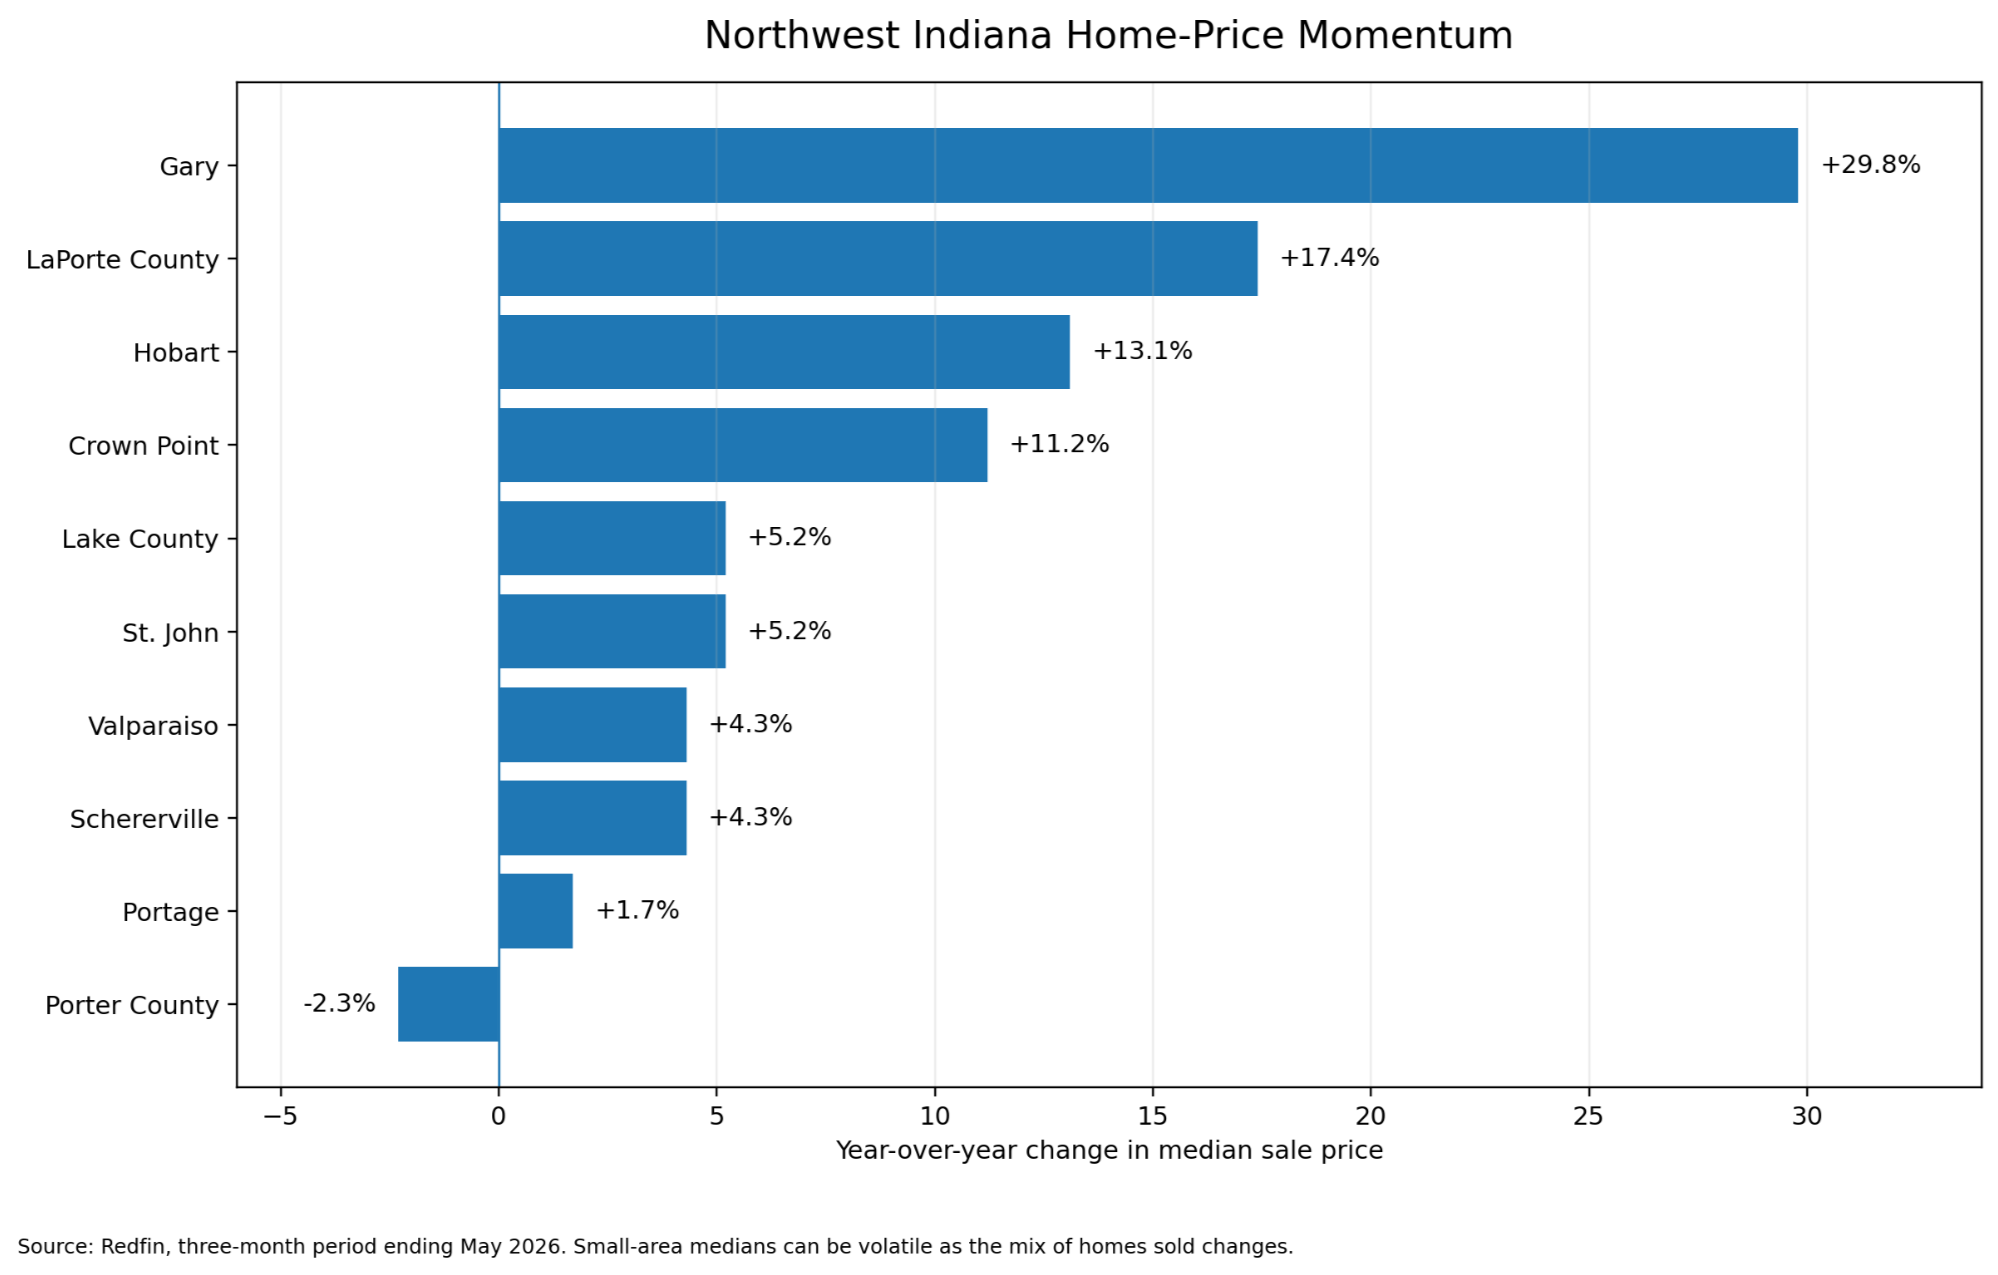
Suggested caption: Northwest Indiana’s price performance varies widely by community, with particularly large increases reported in Gary, LaPorte County, Hobart and Crown Point.
Northwest Indiana Versus the Hottest National Markets
Northwest Indiana is not as inventory-starved as Hartford or Rochester, and its homes generally do not attract the same extraordinary level of listing traffic. That is healthy.
The region is competitive without being completely detached from fundamentals. Buyers may need to move quickly on an accurately priced, updated home, but they are not universally facing the extreme conditions seen in America’s hottest Northeastern markets.
Northwest Indiana’s strongest national advantage is not raw appreciation. It is the combination of:
-
Affordability
-
Access to the Chicago economy
-
Limited existing inventory
-
Diverse housing stock
-
Indiana’s tax environment
-
Availability of suburban, small-city and rural lifestyles within one region
That combination gives the area resilience.
Northwest Indiana Versus the Cooling Sun Belt
Compared with markets such as Austin, Phoenix, Denver and portions of Florida or Texas, Northwest Indiana has experienced less overbuilding.
Its new-construction inventory has recently declined rather than ballooned. Existing inventory has increased only modestly. Sellers therefore face less direct competition from builders offering major rate buydowns and closing-cost incentives.
The tradeoff is that Northwest Indiana buyers have fewer choices. A buyer in Phoenix may be able to compare dozens of similar homes and negotiate aggressively. A buyer seeking a specific school district, price point and property type in Northwest Indiana may still find only a handful of legitimate options.
What the Market Means for Buyers
Buyers should adjust their strategy to the temperature of the specific market.
In hot and warm markets, speed still matters, but speed should not replace discipline. Buyers should have financing prepared, understand comparable sales and know their maximum comfortable payment before the right property appears.
In cooler markets, buyers can ask for more. Seller-paid closing costs, repair credits, mortgage-rate buydowns and price reductions are increasingly realistic. The greatest opportunity may not be the home with the lowest price, but the home whose seller is most motivated.
Buyers should also compare new construction with existing homes. A builder’s financing incentive can sometimes offset a higher purchase price, while an existing home may offer a better location, larger lot or established neighborhood.
What the Market Means for Sellers
The era of choosing an arbitrary price and waiting for the market to rescue it has ended in most communities.
Even in Northwest Indiana, buyers are sensitive to condition and monthly payment. A home that is priced correctly can still attract strong activity. A home that begins significantly above market value may spend weeks accumulating days on market before eventually selling for less than it could have achieved with a sharper opening strategy.
With nearly one in five national listings receiving a price reduction, the first price is more important than ever.
Sellers should pay particular attention to:
-
Recent competing listings
-
Properties currently under contract
-
Similar homes that failed to sell
-
Condition and presentation
-
Builder incentives in nearby developments
-
The buyer’s monthly payment, not only the sale price
What the Market Means for Investors
Investors should resist chasing appreciation percentages without examining cash flow and transaction volume.
A market reporting 15% or 20% annual price growth may have experienced a change in sales mix rather than genuine property-by-property appreciation. Investors should analyze rents, taxes, insurance, maintenance, vacancy, local employment and replacement cost.
Cooler markets may offer better acquisition terms but weaker near-term appreciation. Hotter markets may offer stronger demand but less favorable cash flow. The best investment market is not automatically the hottest one. It is the market where the expected return adequately compensates for the risk.
The Rest of 2026: What Happens Next?
The most likely outcome is not a nationwide crash or a nationwide boom. It is continued fragmentation.
If mortgage rates remain in the mid-6% range, sales activity will probably remain constrained. Homeowners with older mortgages will continue to limit supply, while affordability will restrict demand.
If rates move closer to 6% or below, demand may improve quickly. The first markets to feel renewed pressure would likely be those with the least inventory, particularly the Midwest and Northeast. Lower rates could help buyers, but they could also revive bidding competition and push prices higher.
The South and West are likely to remain more negotiable because their inventory has already returned to, or exceeded, pre-pandemic levels. That does not guarantee falling prices, but it limits how aggressively sellers can raise them. This outlook is an inference based on current inventory, rate and demand conditions rather than a guarantee of future performance.
The Bottom Line
The national housing market is not frozen, crashing or booming. It is dividing.
The Northeast and portions of the Great Lakes remain hot because buyers are competing for limited supply. The broader Midwest is warm, supported by affordability and inventory that remains well below historical norms. The South and West are cooler, with more listings, more price reductions and greater buyer leverage. A smaller group of metropolitan areas is cold, although some may already be showing early signs of stabilization.
Northwest Indiana remains one of the more compelling markets in this national landscape.
It offers buyers a median price well below the Chicago metro and national market, while limited inventory continues to support homeowners’ values. It is competitive without being uniformly frantic and affordable without being disconnected from a major employment center.
For sellers, that means opportunity still exists, but pricing and presentation matter. For buyers, it means there are still values available, but the best homes may move quickly. For investors, it means the region’s fundamentals should be evaluated community by community rather than through one broad Northwest Indiana statistic.
The market’s temperature can change from one state to another, one county to another and sometimes one neighborhood to the next. In 2026, understanding those differences is not a small detail. It is the entire game.
Thinking About Buying, Selling or Investing in Northwest Indiana?
For a detailed analysis of your property, neighborhood or target community, contact Brent W. Wright, TWG Powered by McColly, at 219.406.7195.
Data note: National figures come from the National Association of REALTORS, Realtor.com, Redfin, Freddie Mac and the U.S. Census Bureau. Northwest Indiana figures include NIRA MLS data summarized by Quadwalls and Redfin’s rolling local-market reports. Listing prices, closed-sale prices and rolling medians measure different aspects of the market and should not be treated as interchangeable.
Categories
- All Blogs (89)
- affodability (1)
- Brent's Market Minute (9)
- Build Your Dream Home (4)
- Buyers (4)
- Buying & Selling Homes (16)
- buying a home (11)
- Cedar Lake IN (1)
- Cedar Lake Indiana Real Estate (1)
- Chesterton IN Real Estate (2)
- Crown Point IN (4)
- Crown Point Indiana Real Estate (1)
- First-Time Homebuyers (8)
- Golf Course Communities (1)
- Griffith Indiana Real Estate (1)
- Home Buying Tips (10)
- Home for sale (22)
- home values (1)
- Homes for Sale (4)
- Houses for sale (3)
- Housing Market Trends (8)
- Just Listed (2)
- Lake County Indiana Real Estate (2)
- Land & Acreage (1)
- LaPorte County Indiana Real Estate (2)
- Local Market Insighs (2)
- Lots & Land (1)
- Luxury Homes (1)
- Market Update (2)
- Mortgage & Interest Rate Insights (1)
- Munster Indiana (1)
- New Construction (5)
- Northwest Indiana Real Estate (33)
- Northwest Indiana Real Estate Market Updates (11)
- Portage IN (11)
- Portage IN Homes for Sale (6)
- Portage IN Real Estate (8)
- Portage Indiana Homes for Sale (5)
- Portage Indiana Real Estate (1)
- Porter County Indiana Real Estate (2)
- Porter County Real Estate (2)
- Real Estate (41)
- Real Estate Guides (9)
- Real Estate Listings (4)
- Relocation (1)
- RiverTrace Subdivision (4)
- Sellers (3)
- selling a home (3)
- St. John Indiana Real Estate (1)
- Townhomes (2)
- Valparaiso Homes for Sale (2)
- Valparaiso IN (5)
- Westville IN (1)
Recent Posts