Northwest Indiana Housing Market: July 2025 vs. July 2026 | Brent’s Market Minute
Northwest Indiana Housing Market: July 2025 vs. July 2026
Brent's Northwest Indiana Market Minute
What is really happening with the Northwest Indiana housing market?
If you only look at home prices, you might think not much has changed. Prices are still moving higher, homes are still selling, and Northwest Indiana continues to show strength.
But when you dig deeper into the July numbers, the market is definitely changing.
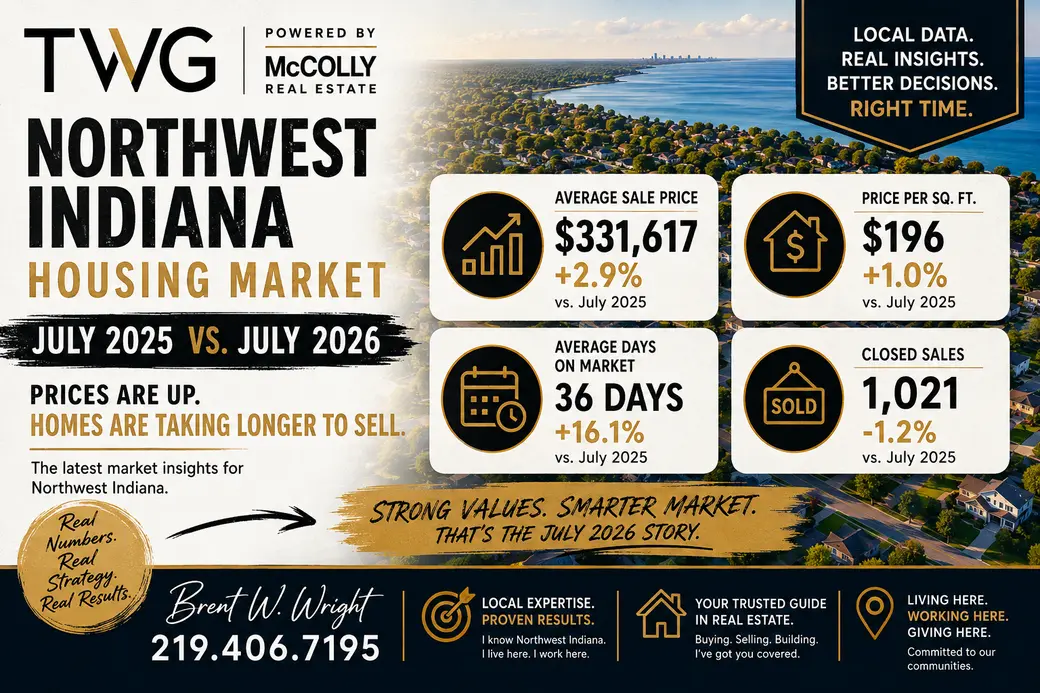
July 2026 brought us slightly fewer home sales than July 2025, higher average prices, higher price per square foot, longer market times and a little more negotiating room for buyers.
That does not mean Northwest Indiana has turned into a buyer's market.
It means the days when virtually anything reasonably priced sold immediately are becoming less common.
And that distinction matters.
July 2025 vs. July 2026 at a Glance
| Northwest Indiana Residential Market | July 2025 | July 2026 | Change |
|---|---|---|---|
| Closed Sales | 1,033 | 1,021 | -1.2% |
| Average Sale Price | $322,299 | $331,617 | +2.9% |
| Median Sale Price | $291,000 | $294,858 | +1.3% |
| Average Sold $/Sq. Ft. | $194 | $196 | +1.0% |
| Median Sold $/Sq. Ft. | $191 | $196 | +2.6% |
| Average Days on Market | 31 | 36 | +16.1% |
| Average Cumulative DOM | 40 | 46 | +15.0% |
| Sold-to-List Ratio | 98.48% | 98.28% | -0.20 pts |
| Sold-to-Original-List Ratio | 96.88% | 96.25% | -0.63 pts |
| Total Sold Volume | $332.9M | $338.6M | +1.7% |
The short version?
Values are still increasing. Sales activity is essentially flat. Homes are taking longer to sell. Buyers are becoming more price-sensitive.
That is the July 2026 Northwest Indiana housing market in one sentence.
Home Prices Are Still Moving Higher
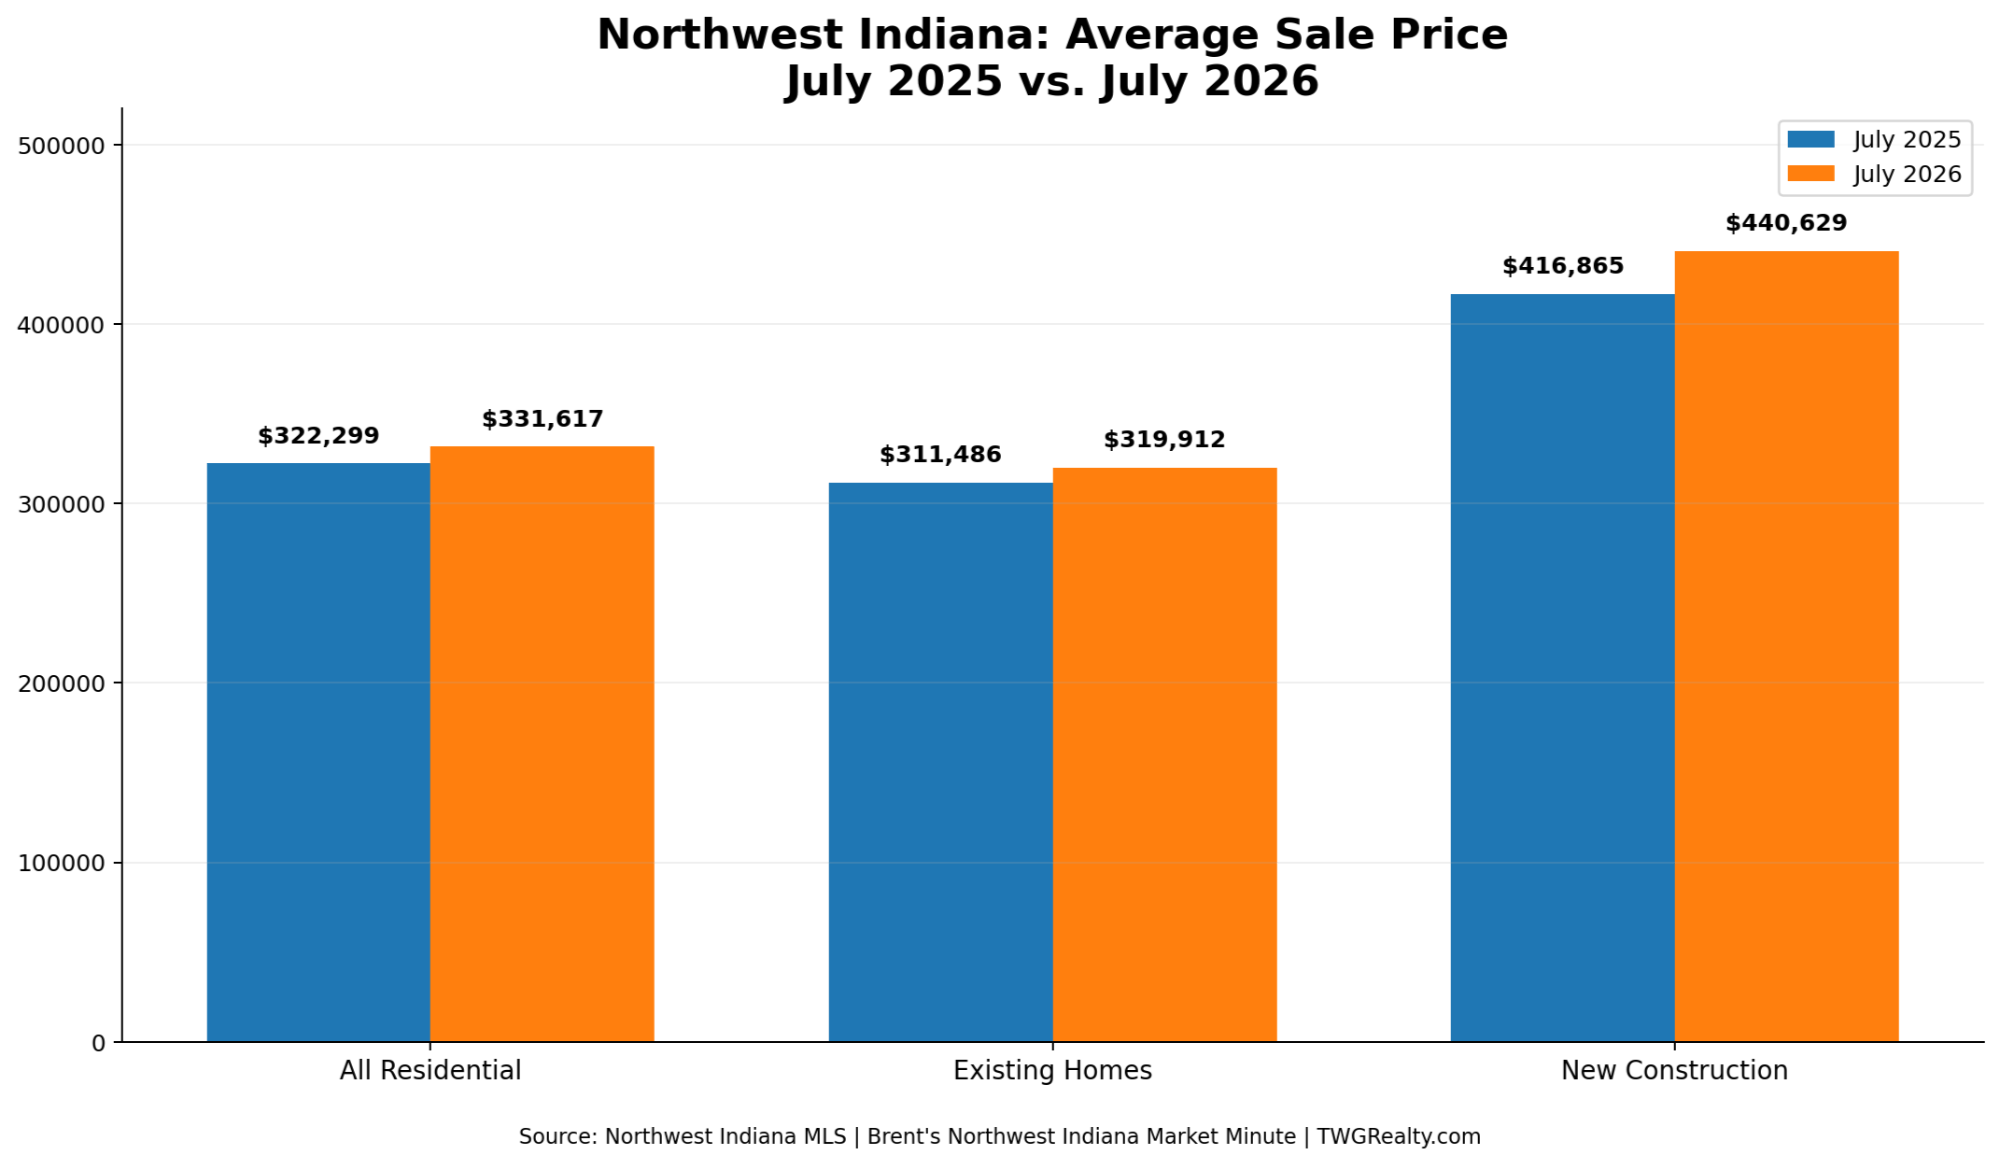
The average Northwest Indiana residential sale increased from $322,299 in July 2025 to $331,617 in July 2026.
That's an increase of approximately 2.9% year over year.
The median moved from $291,000 to $294,858, an increase of approximately 1.3%.
Why do I like looking at both?
Because an average can be influenced by several expensive sales. The median tells us what is happening closer to the middle of the market.
And that's an important part of the July story.
The average rose almost 3%, but the median increased only 1.3%.
So yes, Northwest Indiana home values are still appreciating, but I would describe the market as steady appreciation rather than runaway appreciation.
Price Per Square Foot Deserves More Attention
This is one of my favorite measurements because it helps us look underneath the headline sale price.
Across all residential sales:
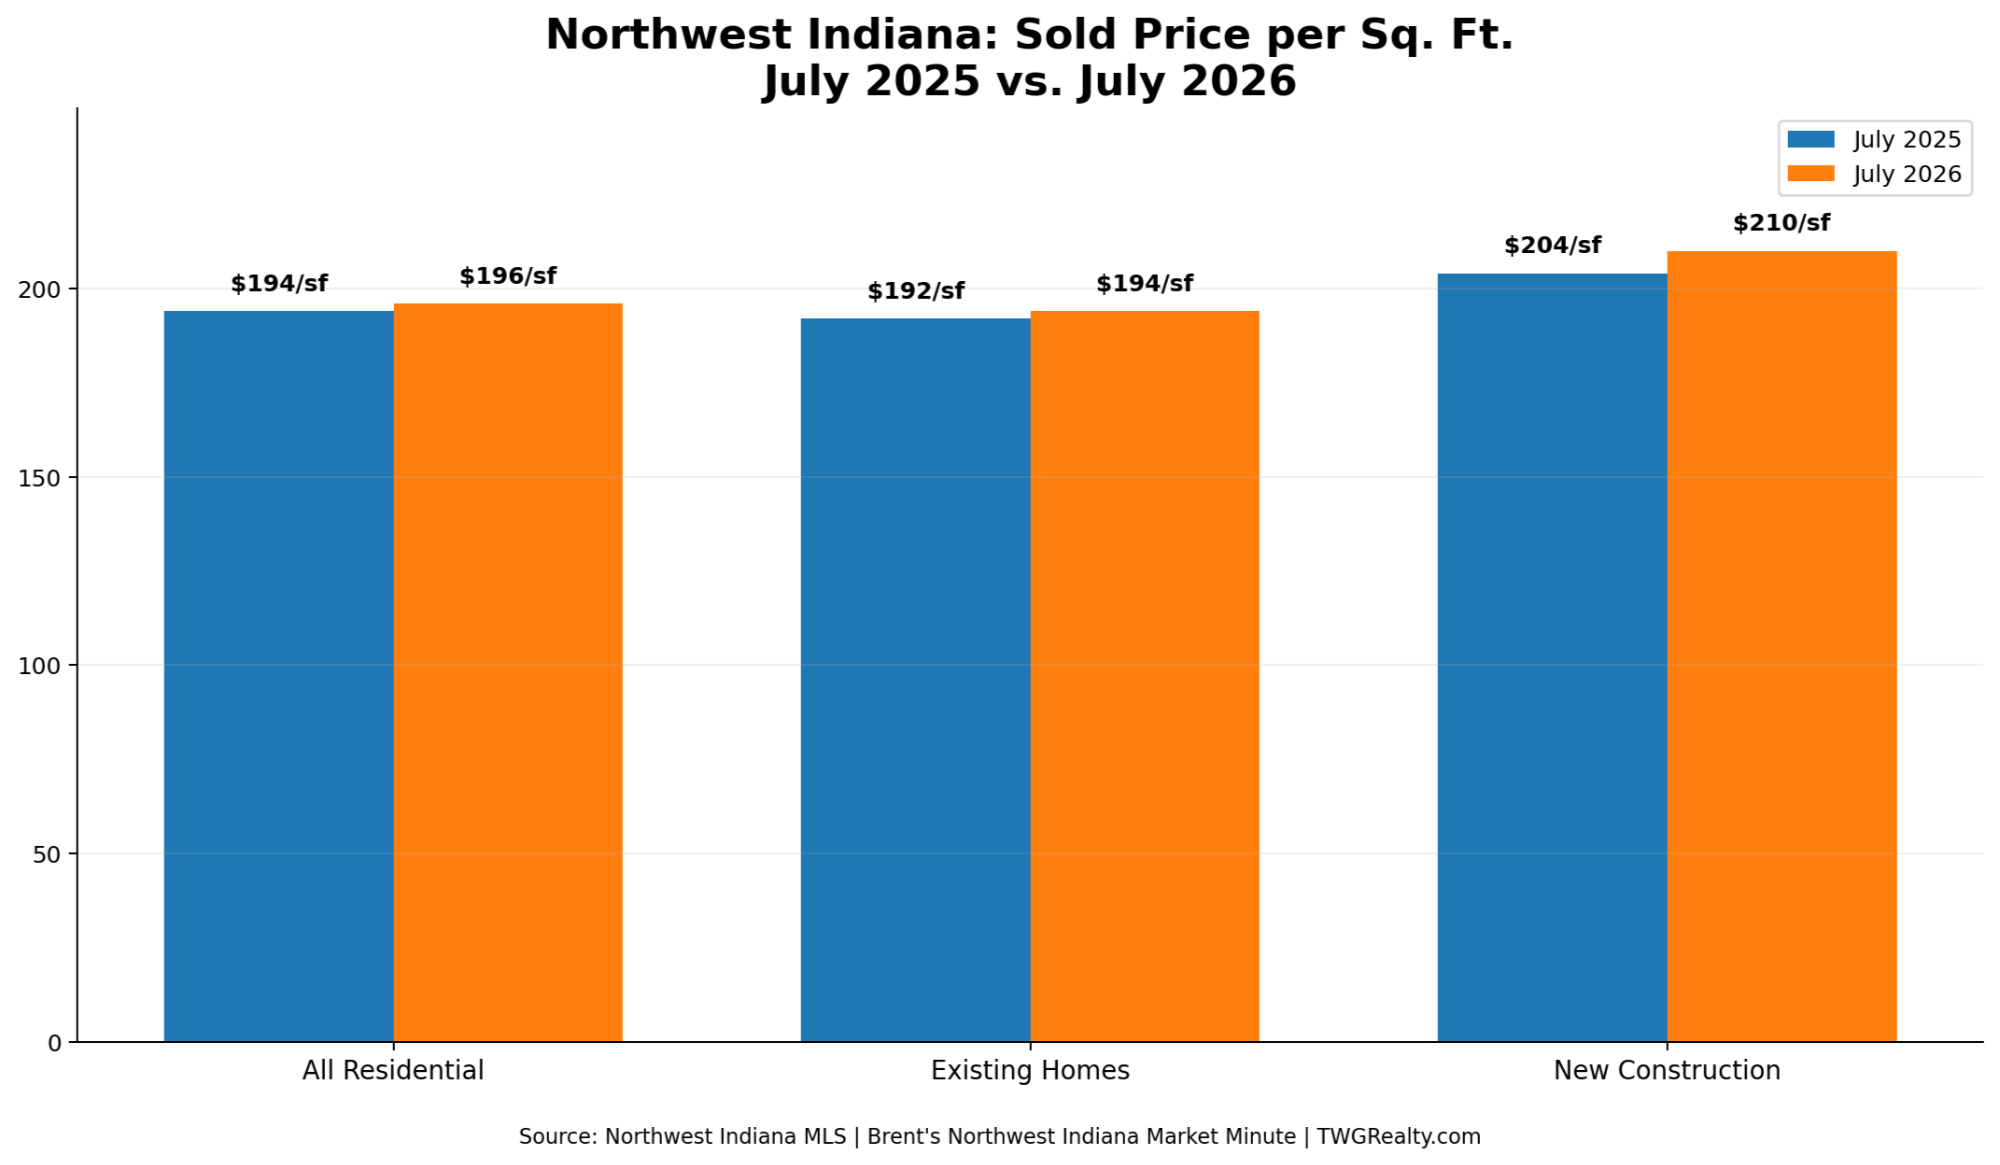
July 2025 average sold price per square foot: $194
July 2026 average sold price per square foot: $196
That's approximately a 1.0% increase.
But the median tells an even stronger story:
July 2025 median: $191/sq. ft.
July 2026 median: $196/sq. ft.
That's approximately a 2.6% increase.
Why does this matter?
Because sale prices can rise simply because larger or more expensive homes sold during a particular month. Price per square foot gives us another lens for determining whether buyers are actually paying more for the underlying housing product.
And in July 2026, they were.
Existing Homes: Prices Up, But Buyers Are More Patient
Existing homes continue to make up the overwhelming majority of Northwest Indiana sales.
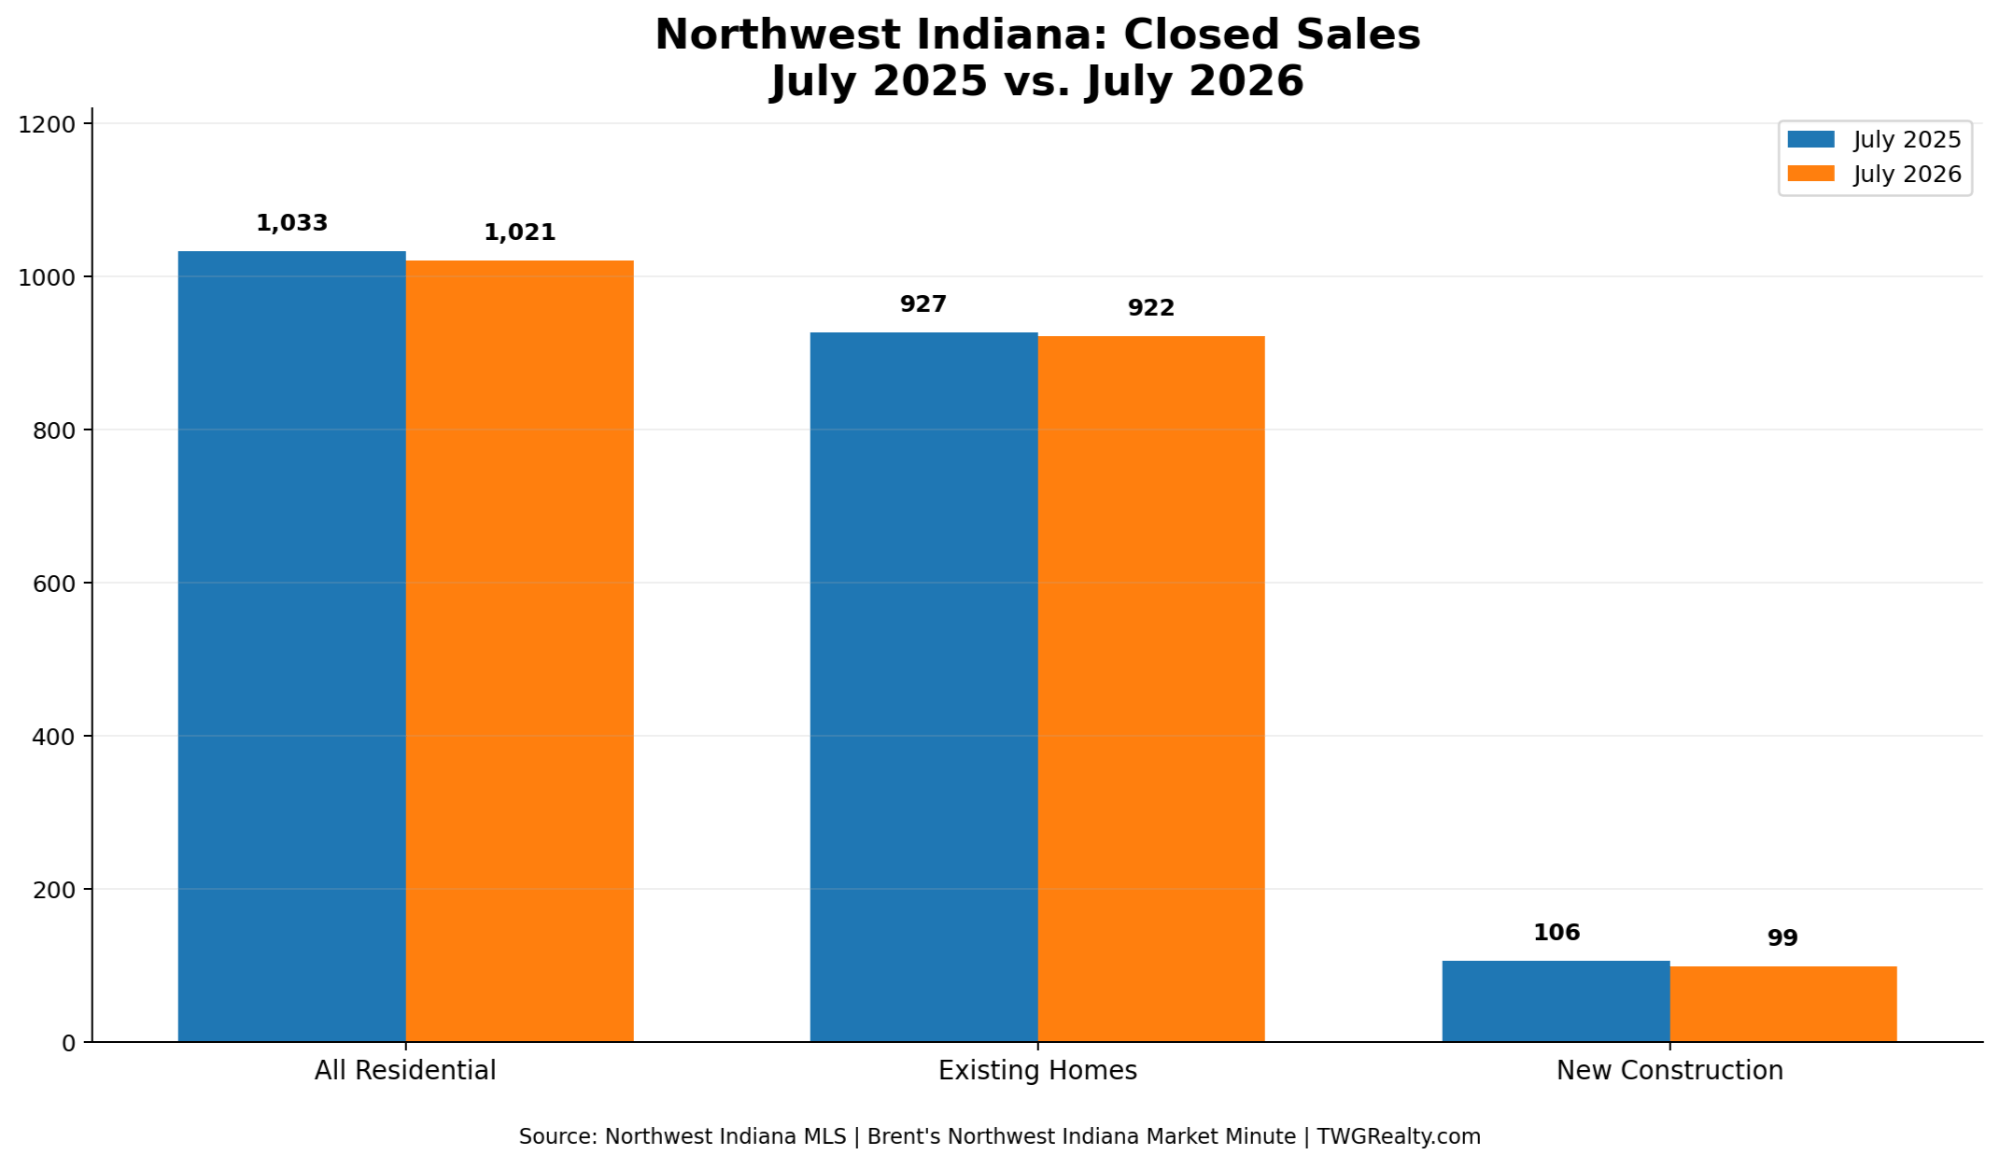
In July 2025, 927 existing homes sold.
In July 2026, 922 sold.
That's essentially flat, down only about 0.5%.
But average price increased from:
$311,486 → $319,912
That's approximately +2.7%.
Average price per square foot increased:
$192 → $194
And the median price per square foot increased even more:
$191 → $196
But here's where the market starts talking to us.
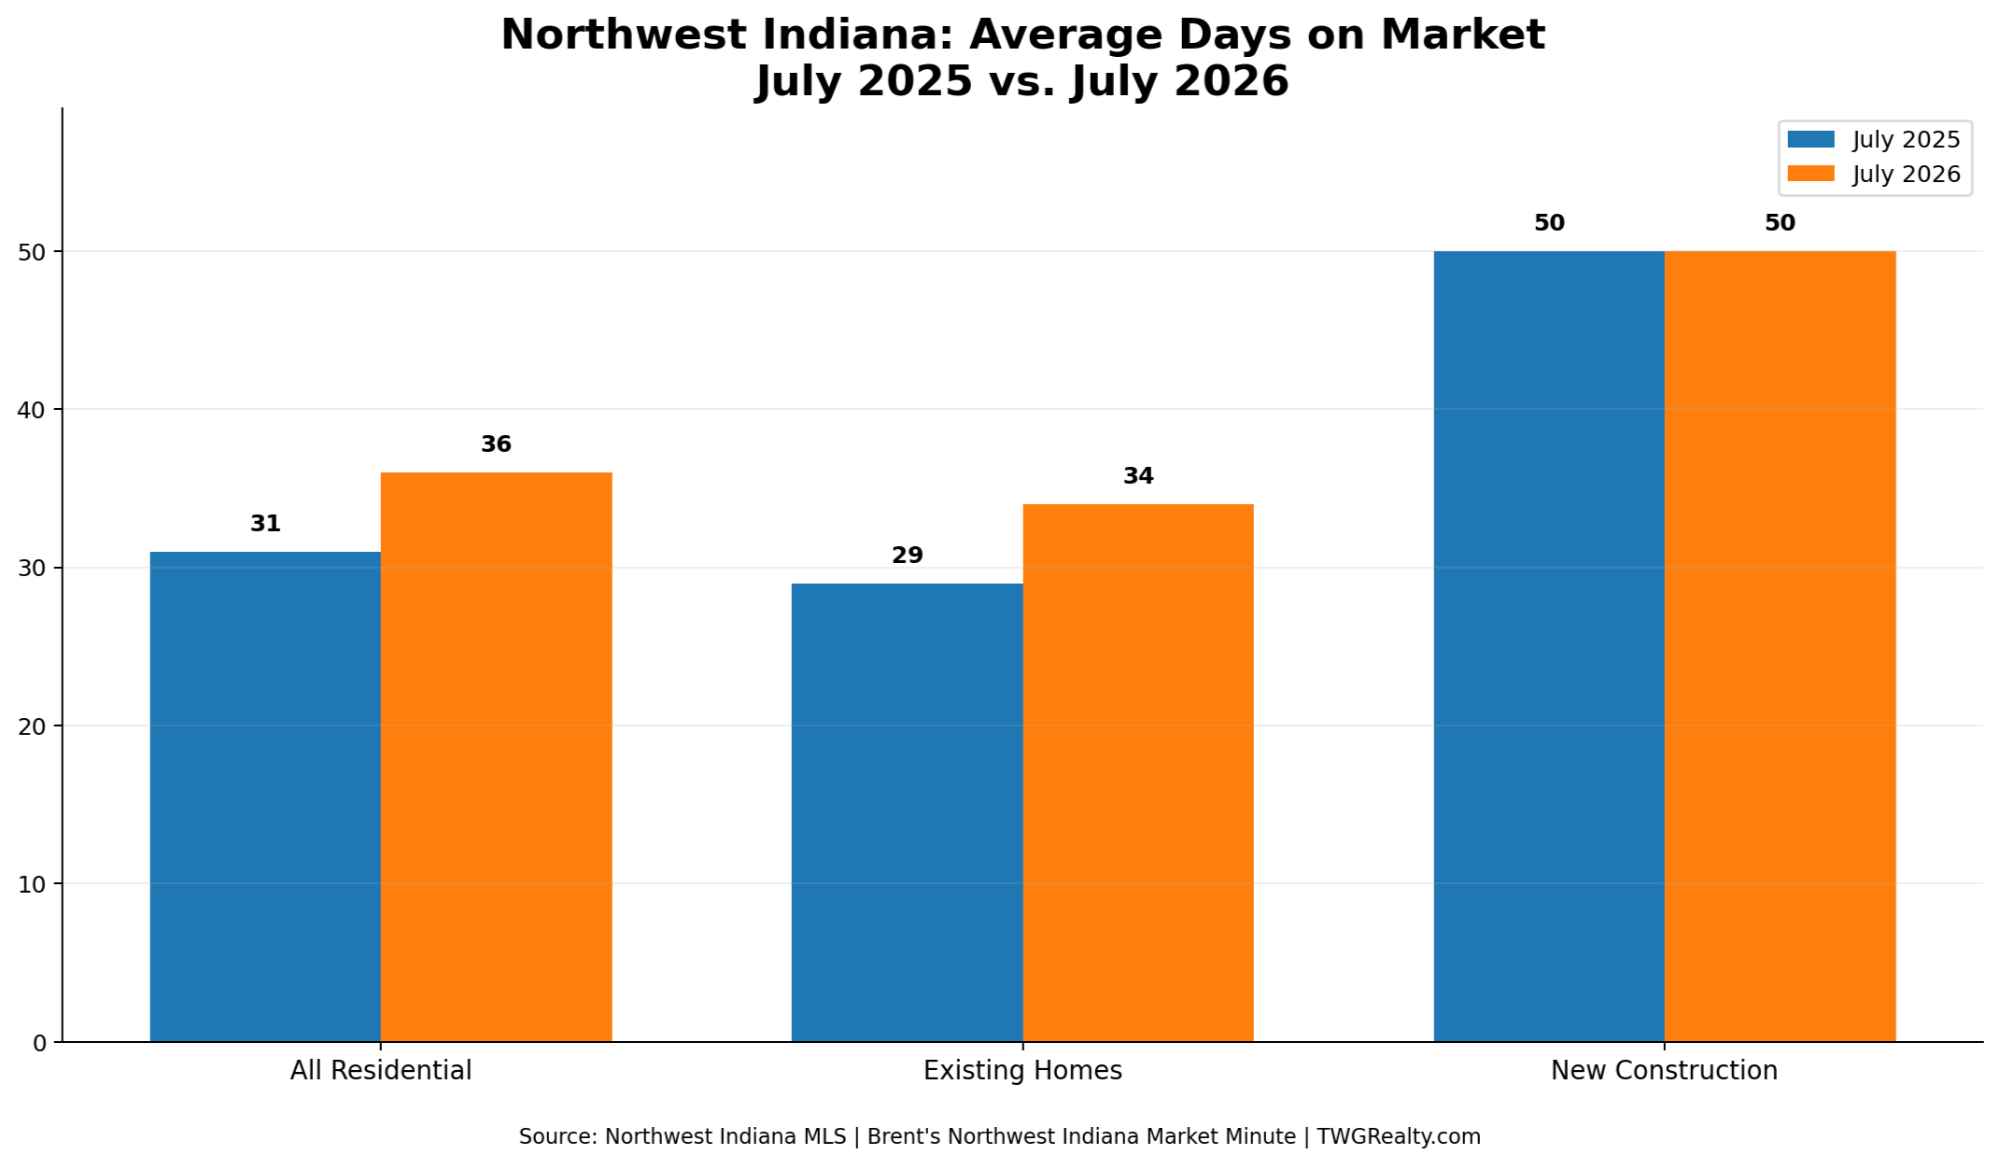
Average days on market increased from:
29 days → 34 days
That's roughly a 17% increase in market time.
Even more telling, 72.4% of existing homes sold within their first 30 days on the market in July 2025.
In July 2026?
68.2%.
So buyers haven't disappeared.
They're simply becoming more selective.
New Construction Is Telling a Different Story
This may be the most interesting segment of the July report.
New-construction closings dropped from:
106 homes in July 2025
to
99 homes in July 2026
That's a decline of approximately 6.6%.
But look at pricing.
Average new-construction sale price increased from:
$416,865 → $440,629
That's a significant 5.7% increase.
Average price per square foot increased from:
$204 → $210
That's another 2.9% increase.
Meanwhile, the median new-construction sale price barely changed:
$399,490 → $399,900.
That is fascinating.
It tells me the increase in the average is being influenced more heavily by the mix of homes being sold, rather than every new home suddenly becoming 5% or 6% more expensive.
That's why I never like looking at a single statistic and calling it the market.
The market is the entire puzzle.
New Construction Is Also Selling Faster at the Front End
There is another interesting wrinkle.
Average new-construction days on market remained exactly:
50 days in 2025
and
50 days in 2026.
But the percentage of new homes selling within 30 days jumped from:
47.2% → 55.6%.
That's a substantial improvement.
So we simultaneously have:
-
Fewer new-construction closings
-
Higher average prices
-
Higher price per square foot
-
More homes selling within 30 days
-
Essentially unchanged average DOM
That suggests the right new-construction product, in the right location and at the right price, is still being absorbed very well.
The market isn't rejecting new construction.
It is sorting it.
The Biggest Change May Actually Be Time
This is the statistic sellers should be paying attention to.
Across the entire Northwest Indiana residential market:
Average DOM increased from 31 days to 36 days.
That is approximately a 16% increase.
Cumulative days on market increased from:
40 days → 46 days.
And the percentage of homes selling within the first 30 days slipped from:
69.8% → 67.0%.
A five-day increase may not sound dramatic.
But across more than 1,000 transactions?
It matters.
It tells us buyers are willing to wait.
They're comparing homes.
They're paying attention to condition.
They're paying attention to updates.
And most importantly...
They're paying attention to price.
Pricing Strategy Matters More in 2026
Here is another number sellers shouldn't ignore.
In July 2025, the average home sold for approximately:
98.48% of its final list price.
In July 2026:
98.28%.
That's not a massive difference.
But compare the sale price to the original asking price.
July 2025:
96.88%
July 2026:
96.25%
That means the typical gap between where sellers initially hoped to sell and where buyers ultimately agreed to buy has widened.
In other words:
The market is still strong, but it is becoming less forgiving of aggressive pricing.
That is exactly why properly pricing a home from Day One matters.
Closed Sales Are Nearly Flat
We had:
1,033 closed residential sales in July 2025
versus
1,021 in July 2026.
A decline of just 1.2%.
I would not classify that as a meaningful collapse in demand.
In fact, despite fewer transactions, total dollar volume increased from approximately:
$332.9 million → $338.6 million.
So fewer homes sold, but the homes that did sell were worth more collectively.
That's another sign that Northwest Indiana pricing remains resilient.
What Does This Mean for Northwest Indiana Sellers?
The July numbers are pretty straightforward.
Homes are still selling.
Values are still increasing.
But buyers are no longer giving every seller a free pass.
A home that is priced correctly, shows well and is marketed aggressively can still generate strong activity.
But homes that enter the market overpriced may sit longer and eventually require price reductions.
And once a listing begins accumulating market time, buyers notice.
What Does This Mean for Buyers?
Buyers have something in 2026 that many of them didn't feel they had a few years ago:
A little breathing room.
That doesn't mean every home can be bought at a discount.
The best homes still move quickly.
But buyers may have more opportunities to negotiate on homes that have accumulated market time, need updating or entered the market too aggressively priced.
And with almost one-third of July sales taking longer than 30 days, there are opportunities if you know where to look.
Brent's Bottom Line
July 2026 was not dramatically hotter or dramatically colder than July 2025.
It was different.
Prices continued to move higher.
Price per square foot continued to climb.
Sales volume remained remarkably resilient.
But homes took longer to sell and buyers became more selective.
That's why I would describe Northwest Indiana today as a healthy but more balanced housing market.
The market isn't crashing.
It isn't exploding.
It's becoming more disciplined.
And frankly, that's not necessarily a bad thing.
Whether you're thinking about buying, selling, building or just want to know what your home may be worth in today's Northwest Indiana market, I'd be happy to break the numbers down specifically for your neighborhood and price range.
Brent W. Wright
TWG Powered by McColly Real Estate
www.TWGRealty.com
Market statistics are based on Northwest Indiana MLS closed residential sales for July 2025 and July 2026. Real estate markets can vary significantly by community, property type, condition and price range.
Categories
- All Blogs (92)
- affodability (1)
- Brent's Market Minute (9)
- Build Your Dream Home (4)
- Buyers (4)
- Buying & Selling Homes (17)
- buying a home (14)
- Cedar Lake IN (1)
- Cedar Lake Indiana Real Estate (1)
- Chesterton IN Real Estate (2)
- Crown Point IN (4)
- Crown Point Indiana Real Estate (1)
- First-Time Homebuyers (9)
- Golf Course Communities (1)
- Griffith Indiana Real Estate (1)
- Home Buying Tips (10)
- Home for sale (23)
- home values (1)
- Homes for Sale (5)
- Houses for sale (3)
- Housing Market Trends (9)
- illinois to indiana (1)
- Just Listed (2)
- Lake County Indiana Real Estate (2)
- Land & Acreage (1)
- LaPorte County Indiana Real Estate (3)
- Local Market Insighs (2)
- Lots & Land (1)
- Luxury Homes (1)
- Market Update (2)
- Mortgage & Interest Rate Insights (1)
- Munster Indiana (1)
- New Construction (6)
- Northwest Indiana Real Estate (35)
- Northwest Indiana Real Estate Market Updates (11)
- Portage IN (11)
- Portage IN Homes for Sale (6)
- Portage IN Real Estate (8)
- Portage Indiana Homes for Sale (5)
- Portage Indiana Real Estate (1)
- Porter County Indiana Real Estate (2)
- Porter County Real Estate (2)
- Real Estate (41)
- Real Estate Guides (9)
- Real Estate Listings (5)
- Relocation (2)
- RiverTrace Subdivision (4)
- Sellers (3)
- selling a home (4)
- St. John Indiana Real Estate (1)
- Townhomes (2)
- Valparaiso Homes for Sale (2)
- Valparaiso IN (5)
- Westville IN (1)
Recent Posts