Northwest Indiana Home Prices Rise as Sales Slow: October 2026 Market Update
Brent’s Market Minutes: Northwest Indiana Home Prices Rose in October as Sales Slowed
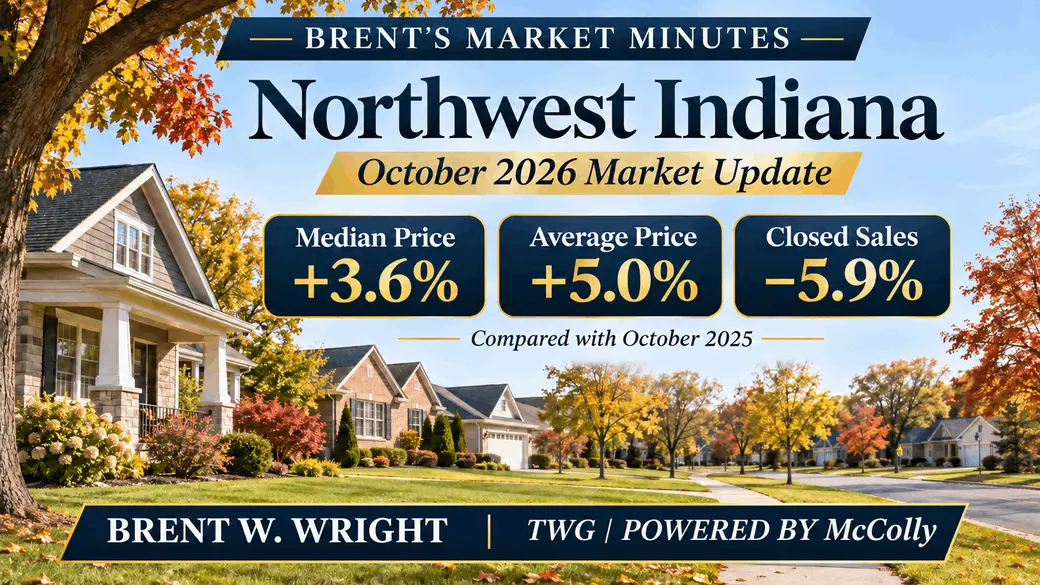
October 2026 versus October 2025
Northwest Indiana’s housing market delivered a mixed October: sale prices increased overall, fewer homes closed, and homes spent slightly longer on the market.
Across the NIRA MLS territory covering Lake, Porter, La Porte, Jasper, Newton, Starke, and Pulaski counties, the median residential sale price increased from $275,000 in October 2025 to $285,000 in October 2026. That is a $10,000 increase, or 3.6%.
The average sale price increased 5.0%, from approximately $315,223 to $330,890.
Meanwhile, closed sales declined from 959 to 902, a decrease of 57 transactions, or 5.9%.
Those regional figures matter, but they do not tell the whole story. Single-family homes, condos, half duplexes, townhouses, and manufactured homes had different results.
October’s regional scorecard
| Measure | October 2025 | October 2026 | Change |
|---|---|---|---|
| Closed residential sales | 959 | 902 | −5.9% |
| Median sale price | $275,000 | $285,000 | +3.6% |
| Average sale price | $315,223 | $330,890 | +5.0% |
| Total dollar volume sold | $302.30 million | $298.46 million | −1.3% |
| Active listings* | 2,918 | 2,720 | −6.8% |
| New listings* | 1,357 | 1,324 | −2.4% |
| Pending listings* | 815 | 876 | +7.5% |
| Months of inventory* | 3.04 | 3.02 | Essentially unchanged |
| Average days on market* | 36 | 38 | 2 days longer |
| Median days on market* | 17 | 19 | 2 days longer |
Inventory, listing activity, and market-time figures use the MLS Market Trends export consistently.
Prices increased, but “value” needs context
Both the median and average sale prices increased compared with October 2025.
The median is the midpoint of the sales: half sold for more and half for less. It is less affected by a few exceptionally expensive transactions than the average, which is why I like to look at both.
October’s 3.6% median increase and 5.0% average increase indicate that the middle sale price and the overall average moved higher. They do not establish that every property appreciated by those amounts.
The mix of homes sold can change from year to year. Location, size, condition, acreage, and property type all influence the numbers. These reports do not measure the resale performance of the same homes over time.
For an individual homeowner, recent comparable sales remain more useful than applying a regional percentage directly to the property.
Fewer closings, but nearly the same dollar volume
October’s 902 closings generated approximately $298.46 million in sales, compared with $302.30 million a year earlier.
That is a decline of only 1.3% in dollar volume, even though the number of closings fell 5.9%. Higher average sale prices offset much of the reduction in transactions.
Single-family homes accounted for the largest part of the sales slowdown. Their closings declined by 65, while the other property categories combined added a net eight sales.
How each property type performed
| Property type | Sales: 2025 → 2026 | Sales change | Average price: 2025 → 2026 | Price change |
|---|---|---|---|---|
| Single-family residence | 826 → 761 | −7.9% | $321,817 → $341,605 | +6.1% |
| Condominium | 37 → 39 | +5.4% | $227,716 → $232,558 | +2.1% |
| Half duplex | 28 → 36 | +28.6% | $301,296 → $312,851 | +3.8% |
| Townhouse | 57 → 51 | −10.5% | $291,048 → $287,097 | −1.4% |
| Manufactured home | 11 → 14 | +27.3% | $275,091 → $248,305 | −9.7% |
| Mobile home | 0 → 1 | Not applicable | No sales → $50,000 | Not applicable |
| Modular | 0 → 0 | Not applicable | No sales in either period | Not applicable |
Property-type prices are averages, not medians. Categories follow the MLS classifications.
Single-family homes: higher average prices with fewer sales
Single-family residences represented approximately 84% of October 2026 closings, making them the largest influence on the regional market.
Sales declined from 826 to 761, down 7.9%, while the average sale price rose approximately $19,788, reaching $341,605.
Total single-family sales volume decreased 2.2%, from approximately $265.82 million to $259.96 million.
This segment illustrates October’s central theme: fewer completed transactions, but a higher average price among the properties that sold.
For sellers, the regional increase is useful context. The right asking price still depends on the competing homes and recent sales in your specific market.
Condominiums: modest improvement
Condo closings increased from 37 to 39, while the average sale price rose 2.1%, from $227,716 to $232,558.
That is approximately $4,842 more per sale, with total condo sales volume increasing 7.6% to about $9.07 million.
These were modest gains. With only two additional closings, I would describe the condo results as an improvement rather than a dramatic acceleration.
Half duplexes: growth in sales and average price
Half duplexes recorded 36 closings, compared with 28 a year earlier, an increase of 28.6%.
The average sale price rose 3.8%, from $301,296 to $312,851. Total sales volume increased 33.5% to approximately $11.26 million.
This category had one of the stronger combinations of transaction growth and average-price growth. Still, the percentage increase in sales represents eight additional closings, so the small sample deserves consideration.
Townhouses: fewer sales and a slightly lower average price
Townhouse closings declined from 57 to 51, down 10.5%.
The average sale price decreased approximately $3,951, from $291,048 to $287,097, a decline of 1.4%. Total sales volume fell 11.7%, to about $14.64 million.
Townhouses therefore did not follow the regional increase in average prices. This is a good example of why property type matters when interpreting market headlines.
It also does not mean every townhouse lost value. The specific properties sold in each October may differ.
Manufactured homes: more transactions at a lower average price
Manufactured-home closings increased from 11 to 14, up 27.3%.
Their average sale price declined 9.7%, from $275,091 to $248,305. Despite the lower average, total sales volume increased 14.9% to approximately $3.48 million, because more properties sold.
With just 14 transactions, differences in acreage, location, condition, or home size could meaningfully affect the average. The report does not separate those influences, so this is not sufficient evidence of a uniform decline in manufactured-home values.
Mobile and modular homes: insufficient sales for a price trend
The mobile-home category had one October 2026 sale at $50,000, compared with none in October 2025.
The modular category had no closings in either October.
Neither category provides enough completed sales for a meaningful year-over-year price comparison. No sales means no average can be calculated—not that the properties have no value.
Inventory was lower, while the supply-to-sales relationship barely changed
The Market Trends report shows active listings declining 6.8%, from 2,918 to 2,720. New listings declined 2.4%, from 1,357 to 1,324.
At the same time, reported months of inventory stayed close to three months: 3.04 in October 2025 and 3.02 in October 2026.
Those figures are consistent with active listings divided by that month’s closed sales. Because both active listings and closings declined, the relationship between them changed very little.
The pending-listing count increased 7.5%, from 815 to 876. That is a positive activity signal alongside the decline in completed sales, although pending transactions are not guaranteed to close.
Homes took slightly longer, and negotiations remained part of the market
The monthly trend series shows average days on market increasing from 36 to 38, and median days on market increasing from 17 to 19.
That is a modest slowdown. These figures describe the marketing time of homes that sold; they do not mean a seller should expect the entire listing-to-closing process to take 19 or 38 days.
The closed-sales reports also show the average sale-to-list-price ratio edging down from 98.13% to 97.81%, a decrease of 0.32 percentage points.
Measured against original asking prices, the average ratio was 95.77% in October 2026, compared with 95.62% a year earlier—little changed.
Together, these measures suggest that pricing and negotiations still mattered. The ratio to the latest list price does not capture all earlier price reductions, and neither ratio accounts for every possible concession or transaction expense.
My take for Northwest Indiana buyers and sellers
October’s numbers show a market with higher regional sale prices, fewer closings, and slightly longer marketing times.
For sellers, the increase in median and average prices is encouraging, but the results vary by property type. A townhouse seller and a single-family seller should not assume the same regional headline describes their situations equally well.
For buyers, slightly longer marketing times may provide more room to evaluate a property, but lower active-listing counts mean selection has not expanded across the region as a whole.
The most useful question is how homes like yours—or the home you want to buy—are performing in that particular community and price range.
If you would like a closer look at your neighborhood, reach out. I can help you compare recent sales, current competition, and the details that matter to your next move.
Brent Wright
The Wright Way to Buy & Sell Real Estate
Sources: Northwest Indiana MLS/Flexmls October 2025 and October 2026 Search Statistics, Market Trends export, and Year Over Year Comparison, prepared November 11, 2026. Coverage follows the stated seven-county NIRA MLS territory. Sales counts and dollar volumes reconcile between the PDF reports; regional median prices agree with the monthly export. Average prices are rounded from sold volume divided by closings. Inventory, listing activity, and days on market use the Market Trends series; those measures differ in other report formats. Property-type comparisons use the Year Over Year report. Sale-to-list ratios use the Search Statistics reports, which exclude ratios below 50% or above 200%. Percent changes are rounded to one decimal. Regional results do not establish the trend in every county or the appreciation of an individual home. MLS information is deemed reliable but is not guaranteed.
Categories
- All Blogs (96)
- affodability (1)
- Brent's Market Minute (11)
- Build Your Dream Home (4)
- Buyers (5)
- Buying & Selling Homes (20)
- buying a home (16)
- Cedar Lake IN (1)
- Cedar Lake Indiana Real Estate (1)
- Chesterton IN Real Estate (2)
- Crown Point IN (4)
- Crown Point Indiana Real Estate (1)
- First-Time Homebuyers (11)
- Golf Course Communities (1)
- Griffith Indiana Real Estate (1)
- Home Buying Tips (12)
- Home for sale (23)
- home values (2)
- Homes for Sale (6)
- Houses for sale (3)
- Housing Market Trends (10)
- illinois to indiana (2)
- Just Listed (2)
- Lake County Indiana Real Estate (3)
- Land & Acreage (1)
- LaPorte County Indiana Real Estate (4)
- Local Market Insighs (4)
- Lots & Land (1)
- Luxury Homes (2)
- Market Update (3)
- Mortgage & Interest Rate Insights (1)
- Munster Indiana (1)
- New Construction (6)
- Northwest Indiana Real Estate (38)
- Northwest Indiana Real Estate Market Updates (15)
- Portage IN (11)
- Portage IN Homes for Sale (6)
- Portage IN Real Estate (8)
- Portage Indiana Homes for Sale (5)
- Portage Indiana Real Estate (1)
- Porter County Indiana Real Estate (3)
- Porter County Real Estate (2)
- Real Estate (41)
- Real Estate Guides (9)
- Real Estate Listings (5)
- Relocation (3)
- RiverTrace Subdivision (4)
- Sellers (3)
- selling a home (4)
- St. John Indiana Real Estate (1)
- Townhomes (2)
- Valparaiso Homes for Sale (2)
- Valparaiso IN (5)
- Westville IN (1)
Recent Posts