Brent’s Market Minutes: September Sales Slow, Price per Square Foot Climbs
Brent’s Market Minutes
September 2026 vs. September 2025: Fewer Closings, Higher Prices per Foot, and a Little More Patience
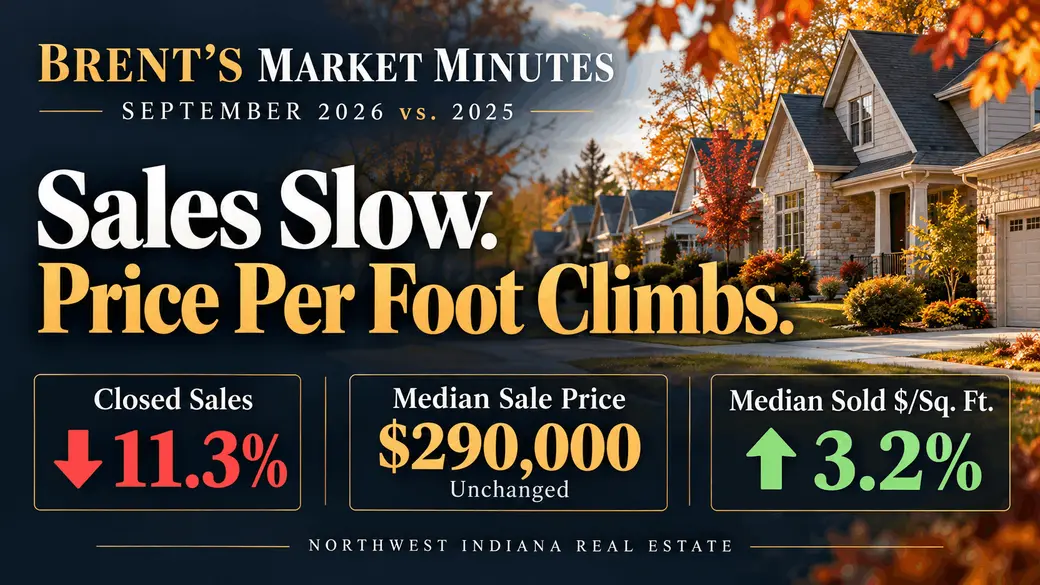
September’s numbers tell an interesting story about Northwest Indiana real estate. We had fewer homes close, the average sale price climbed, and buyers paid more per square foot. At the same time, the median sale price didn’t budge.
So, did prices go up? Yes, by some measures. Did every home become worth 8% more? These reports don’t tell us that.
Let’s break down what changed—and what it means when you’re buying or selling.
| Market measure | September 2025 | September 2026 | What changed? |
|---|---|---|---|
| Closed residential sales | 980 | 869 | 111 fewer sales, down 11.3% |
| Average sale price | $317,308 | $342,570 | Up $25,262, or 8.0% |
| Median sale price | $290,000 | $290,000 | No change |
| Average sold price per square foot | $188 | $203 | Up $15, or 8.0% |
| Median sold price per square foot | $188 | $194 | Up $6, or 3.2% |
| Total sales dollar volume | $310,962,574 | $297,693,372 | Down $13.27 million, or 4.3% |
| Average final asking price | $323,278 | $349,471 | Up 8.1% |
| Median final asking price | $294,900 | $299,000 | Up 1.4% |
| Average days on market | 35 | 40 | 5 days longer |
| Median days on market | 20 | 21 | 1 day longer |
| Average cumulative days on market | 45 | 51 | 6 days longer |
| Median cumulative days on market | 23 | 25 | 2 days longer |
| Average sale-to-final-asking-price ratio | 97.94% | 97.94% | Unchanged |
| Median sale-to-final-asking-price ratio | 99.23% | 99.36% | Up 0.13 percentage points |
Figures cover Northwest Indiana MLS residential properties that closed September 1–30 in each year. Percentage changes are calculated from the displayed report figures, which include rounded price-per-square-foot amounts.
Fewer homes crossed the finish line
September 2026 recorded 869 closed sales, compared with 980 in September 2025. That’s 111 fewer closings—a decline of 11.3%.
That is a meaningful drop in completed transactions. But fewer closings alone don’t tell us why activity slowed. These reports don’t include available inventory, pending contracts, mortgage rates, or buyer traffic.
What we can say is that fewer homes changed hands during the month.
The total dollar value of those sales also declined, from about $311 million to $297.7 million, a decrease of 4.3%. Why did dollar volume fall less than the number of sales? Because the higher average sale price partly offset the decline in closings.
The average price went up—but the middle stayed put
The average sale price increased nearly 8%, reaching $342,570. That’s $25,262 higher than last September.
Meanwhile, the median sale price stayed at $290,000.
Here’s why both numbers deserve a seat at the table: the average is sensitive to expensive transactions. The median represents the middle sale, with half the sales below it and half above it.
If more expensive homes sell—or a handful of especially expensive properties close—the average can rise without the middle of the market moving much.
The highest reported sale increased from $1,825,000 in 2025 to $2,612,500 in 2026. That illustrates the kind of transaction that can pull an average upward, though these summary reports don’t show how much the overall mix changed.
My read? The average transaction became more expensive, while the midpoint held steady. That’s a more useful description than saying all home values increased 8%.
Let’s talk price per square foot
This is where things get especially interesting.
The average sold price per square foot rose from $188 to $203—an increase of $15 per foot, or about 8%.
The median sold price per square foot increased from $188 to $194, gaining $6 per foot, or 3.2%.
Both measures moved up. The median gives us a more conservative headline because it is less sensitive to unusually high or low results.
For a little perspective, a $6-per-square-foot difference works out to $12,000 across 2,000 square feet. That’s an illustration of the math, not an automatic increase in a particular home’s value. Location, condition, layout, updates, and the way square footage is reported all matter.
Price per foot is a useful tool. It still needs good comparable properties standing beside it.
Similar total prices, slightly smaller homes
The average size of homes sold edged down from 1,681 to 1,675 square feet—a difference of just six square feet.
Median size declined more noticeably, from 1,549 to 1,512 square feet, or about 2.4%.
Put that alongside the flat median sale price and higher median price per foot, and the figures are consistent with buyers paying similar total prices for somewhat smaller homes.
There’s a catch: those medians are calculated separately. They don’t necessarily describe the same house. We can identify the pattern, but we can’t turn these summary figures into a precise comparison of matching properties.
Homes needed a little more time
Average days on market increased from 35 to 40 days.
The median moved from 20 to 21 days. That’s a much smaller change, suggesting that the middle sale followed a similar timetable while slower-selling properties contributed to the higher average.
The breakdown helps tell that story:
| Time on market among September closings | 2025 | 2026 | Change |
|---|---|---|---|
| 0–30 days | 62.65% | 60.64% | Down 2.01 percentage points |
| 121+ days | 4.69% | 7.02% | Up 2.33 percentage points |
| 121+ cumulative days | 8.98% | 10.93% | Up 1.95 percentage points |
About six out of ten September 2026 closings had 30 days or less of reported market time. There was still plenty of activity among properties that moved quickly.
But a larger share had been on the market for more than 120 days.
Cumulative days on market provides another view of the longer selling timeline. Its average rose from 45 to 51 days, and its median increased from 23 to 25 days.
For sellers, that means allowing room in the plan for a longer marketing period instead of assuming an immediate offer.
Were buyers getting bigger discounts?
Across all qualifying sales, the average sale-to-final-asking-price ratio was exactly the same in both years: 97.94%.
That means sales averaged about 2.06% below the final asking price. The median ratio edged up from 99.23% to 99.36%, placing the middle ratio very close to full asking price.
So, despite fewer closings and longer average market time, the overall discount from the final asking price did not widen.
The key word is final. A home may have had one or more price reductions before reaching the asking price used in this comparison.
Market time also made a difference in the 2026 results:
| September 2026 market time | Average percentage of final asking price received |
|---|---|
| 0–30 days | 98.94% |
| 121+ days | 95.04% |
The faster-selling group closed closer to asking price. The longer-selling group showed more negotiating room.
That supports the case for realistic pricing from the start. It doesn’t prove that time alone caused the discount; condition, location, and other property differences could also contribute.
One number needs a serious double-check
The 2025 report includes an original asking price of $1,015,000,000.
Yes, that says more than a billion dollars.
That entry appears erroneous and pushes the reported average original asking price to $1,368,627. I would leave the 2025 average original asking price and original asking-price dollar volume out of a market comparison until that record is verified.
The ordinary final asking-price and sold-price figures are separate fields. The problem is a reminder that even an MLS report deserves a careful read before a number becomes a headline.
What I’d take away as a seller
The price-per-square-foot results are encouraging, and sellers continued to receive a high percentage of their final asking prices.
But fewer completed sales and a larger share of long-market-time properties make accurate pricing especially important.
An 8% increase in the regional average sale price doesn’t automatically justify adding 8% to your home’s asking price. Your best guide is the recent competition and closed sales that closely match your property.
The goal is to give buyers a clear reason to choose your home at its asking price.
What I’d take away as a buyer
There may be opportunities among properties that have been sitting, particularly when their asking prices haven’t kept pace with buyer response.
Still, the overall numbers don’t show deep discounts across the board. Sellers averaged nearly 98% of final asking price, and the faster-selling group averaged almost 99%.
Look at the property’s full history, condition, comparable sales, and current competition. A long time on market is a reason to investigate and negotiate—not a guarantee of a bargain.
Brent’s take
September 2026 gave us a market with fewer closings, higher prices per square foot, a steady median sale price, and a slightly longer selling timeline.
There’s strength in the pricing figures and some softness in the pace of activity. Both belong in the conversation.
For buyers and sellers, the opportunity is in understanding the specific property and its competition. The regional numbers set the stage. The local comparables help you make the move.
Source: Northwest Indiana MLS/flexmls September 2025 and September 2026 residential closed-sale reports, prepared October 6, 2026. These reports describe closed sales, not active inventory or pending demand. Some statistics use fewer records because of missing values or ratio exclusions; reported price-change statistics cover only a subset of listings. One month of aggregate results does not establish appreciation for an individual home.
Categories
- All Blogs (93)
- affodability (1)
- Brent's Market Minute (10)
- Build Your Dream Home (4)
- Buyers (4)
- Buying & Selling Homes (18)
- buying a home (14)
- Cedar Lake IN (1)
- Cedar Lake Indiana Real Estate (1)
- Chesterton IN Real Estate (2)
- Crown Point IN (4)
- Crown Point Indiana Real Estate (1)
- First-Time Homebuyers (9)
- Golf Course Communities (1)
- Griffith Indiana Real Estate (1)
- Home Buying Tips (10)
- Home for sale (23)
- home values (1)
- Homes for Sale (5)
- Houses for sale (3)
- Housing Market Trends (10)
- illinois to indiana (1)
- Just Listed (2)
- Lake County Indiana Real Estate (2)
- Land & Acreage (1)
- LaPorte County Indiana Real Estate (3)
- Local Market Insighs (3)
- Lots & Land (1)
- Luxury Homes (1)
- Market Update (3)
- Mortgage & Interest Rate Insights (1)
- Munster Indiana (1)
- New Construction (6)
- Northwest Indiana Real Estate (35)
- Northwest Indiana Real Estate Market Updates (12)
- Portage IN (11)
- Portage IN Homes for Sale (6)
- Portage IN Real Estate (8)
- Portage Indiana Homes for Sale (5)
- Portage Indiana Real Estate (1)
- Porter County Indiana Real Estate (2)
- Porter County Real Estate (2)
- Real Estate (41)
- Real Estate Guides (9)
- Real Estate Listings (5)
- Relocation (2)
- RiverTrace Subdivision (4)
- Sellers (3)
- selling a home (4)
- St. John Indiana Real Estate (1)
- Townhomes (2)
- Valparaiso Homes for Sale (2)
- Valparaiso IN (5)
- Westville IN (1)
Recent Posts